.avif)
How do you track A/B tests using Looker studio and Bigquery?
How do you track A/B tests using Looker studio and Bigquery?
.webp)
Create a Looker Studio dashboard for A/B test monitoring using BigQuery.
In this article, we'll explore the steps involved in setting up a Looker Studio dashboard dedicated to A/B test tracking, with integration via BigQuery.

Contents:
Create a Looker Studio dashboard for A/B test monitoring using BigQuery.
- Background and objectives
- What are the prerequisites for tracking A/B tests with BigQuery and your analytics tool? ?
- Steps to connect your A/B Test tool
- Steps to connect your analytics tool to BigQuery
- Exploiting A/B TEST data in BigQuery
- Create an A/B test monitoring dashboard in Looker Studio
Background and objectives
What is the objective?
Create a Looker Studio dashboard to track your A/B test data, using BigQuery to obtain decisive insights via advanced dataviz.
As in our Dashboard Dashboard - AB Test - Welyft
Whatis BigQuery?
BigQuery is a Google cloud service designed to store, process and analyze large amounts of data quickly.
Here are a few links to find out more:
What's the advantage of using BigQuery?
BigQuery automates A/B test monitoring by executing programmed SQL queries that directly process the raw data received (all data without aggregation) from your analytics tools, enabling precise, customized calculations.
The limits of certain analytics tools?
Using a connector between certain analytics tools and Looker Studio can have its weak points:
- Sampling
- Does not allow advanced calculations (uplift, downlift, statistical confidence)
Sampling can render results imprecise or even distorted. In the situation of an A/B Test where the performances of the variations are similar: it can falsely designate a variation as the winner, leading to erroneous decisions.
So we prefer to use BigQuery for :
- Automation
- Avoid sampling
- Calculate uplifts, downlifts and statistical confidence
Why choose an Analytics tool with a direct connection between A/B Test and BigQuery?
Most A/B Test tools don't offer BigQuery integration, or are only at the Beta stage, which means that BigQuery can't be used for A/B Test data.
We have the framework and objective for creating a Looker Studio A/B test tracking dashboard using BigQuery. Now let's take a look at the prerequisites for this tutorial.
What are the prerequisites for tracking A/B tests with BigQuery and your analytics tool? ?
To track A/B tests with BigQuery and your analytics tool, you need..:
- An analytics account (GA4, Piano, Matomo)
- Have an active billing account with BigQuery
- An active connection between theA/B testing tool and the analytics tool
- A/B test campaigns underway
- Send data from your A/B test campaigns to your analytics tool.
- Knowledge of SQL, as BigQuery queries are set up using SQL language. Without this knowledge, it will be complicated to set them up.
In addition, it should be noted that the process can take time, because of the setting up of all the arrangements for GCP, and the time to receive data from your analytics extraction, as well as the time to prepare SQL queries, allow between a day or two (waiting time) .
We'll now move on to the tutorial for creating a Looker Studio A/B test tracking dashboard using BigQuery.
Throughout this tutorial, we'll be using GA4 as our analytics tool and Kameleoon as our A/B testing tool.
Steps to connect your A/B Test tool
How can you connect your A/B test campaigns to your analytics tool?
Let's take a look at how to connect your A/B testing tool to your analytics tool. In our example, we use GA4 and Kameleoon.
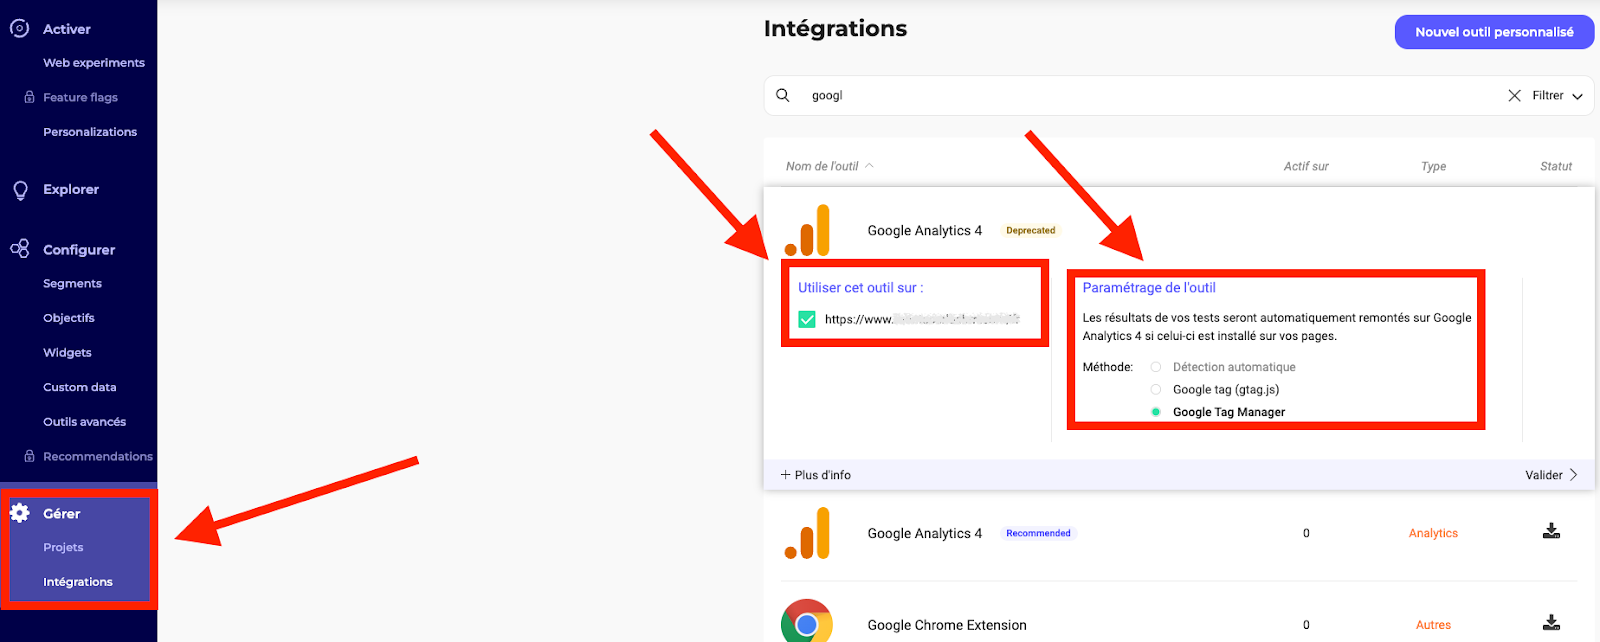
- Log on to your Kameleoon interface: https: //app.kameleoon.com/integrations/dashboard.
- Go to Manage, then Integration, then Install GA4, select your domain and your tool settings (GTM or Gtag ), which will define how the data will be collected for your analytics tool.
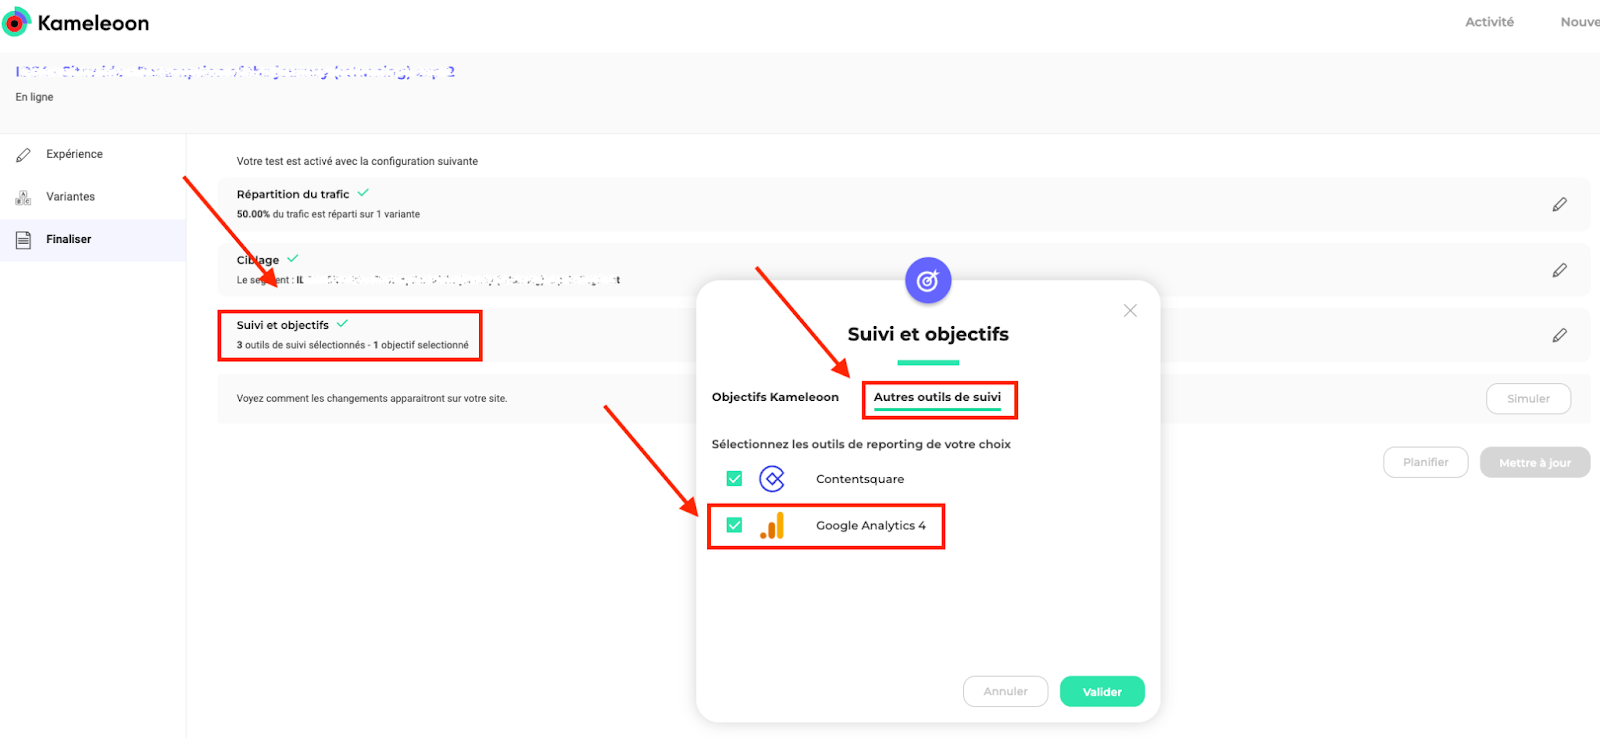
- When creating one of your tests, go to Finalize, then Tracking and Objectives, then "Other tracking tools" and tick GA4, which will send your A/B Test events for this campaign to your analytics tool (you'll need to set up each campaign).
- Launch your test. Google Analytics automatically creates events for all the tests you've launched and set up.
Once you've set up the connection between Kameleoon and GA4, you can check that the data is going back into GA4.
Check that the data is actually being fed into your analytics tool
In your reports, check that events are correctly configured.
In our example, we're using kameleoon and GA4 data. If you're using anotherA/B Test tool, you'll need to use the name of the event you set up during integration with your analysis tool.
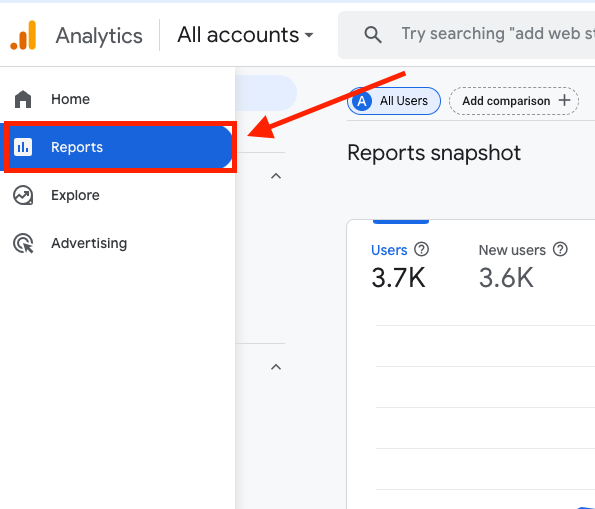
- Log on to your GA4 interface: https: //analytics.google.com/analytics/web.
- Go to the Reportstab, where you'll find all your analyses.
- Click on the Engagement pane to open it, then click on "Events" to access your events interface.
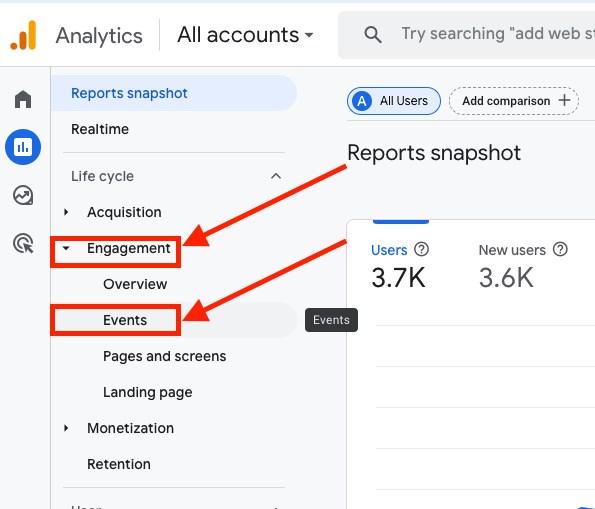
- Once in the interface, you can type into the search bar the name of your event, which you identified during the integration of your analytics and A/B Test tool.
In our example, this is a kameleoon_experiment event.
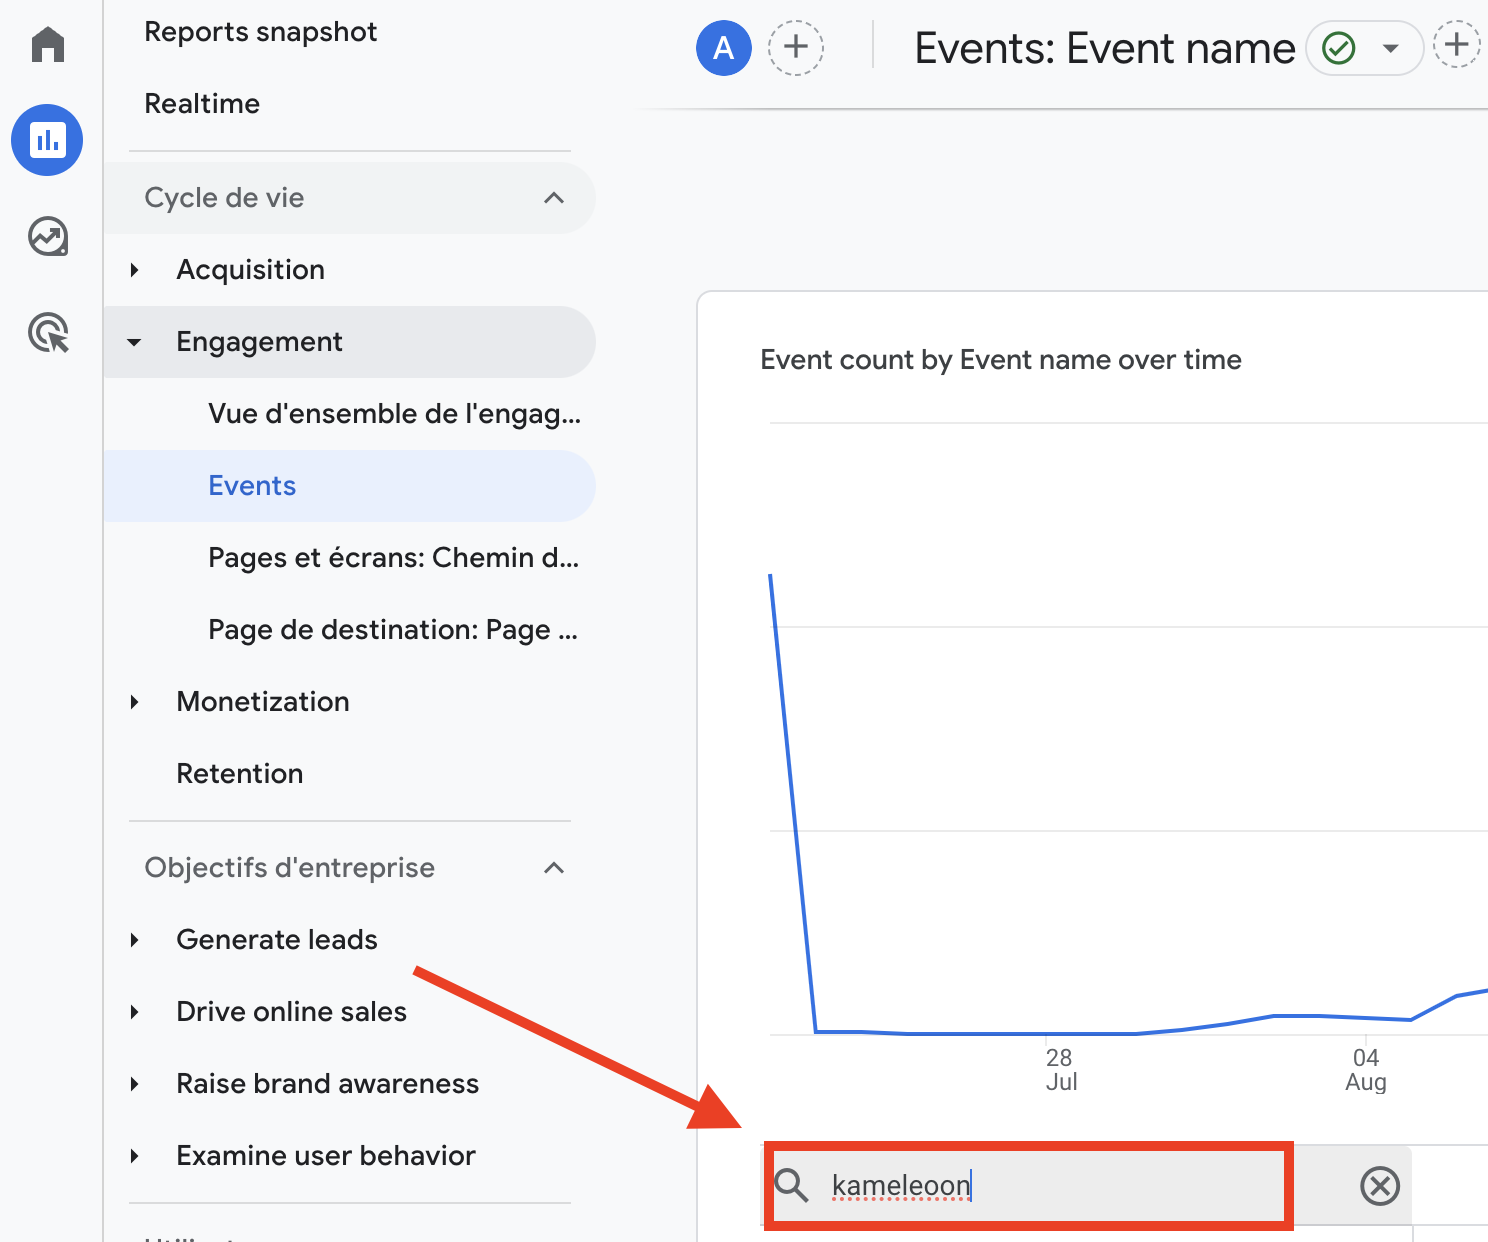
- Click on "enter" to go to your event analysis.
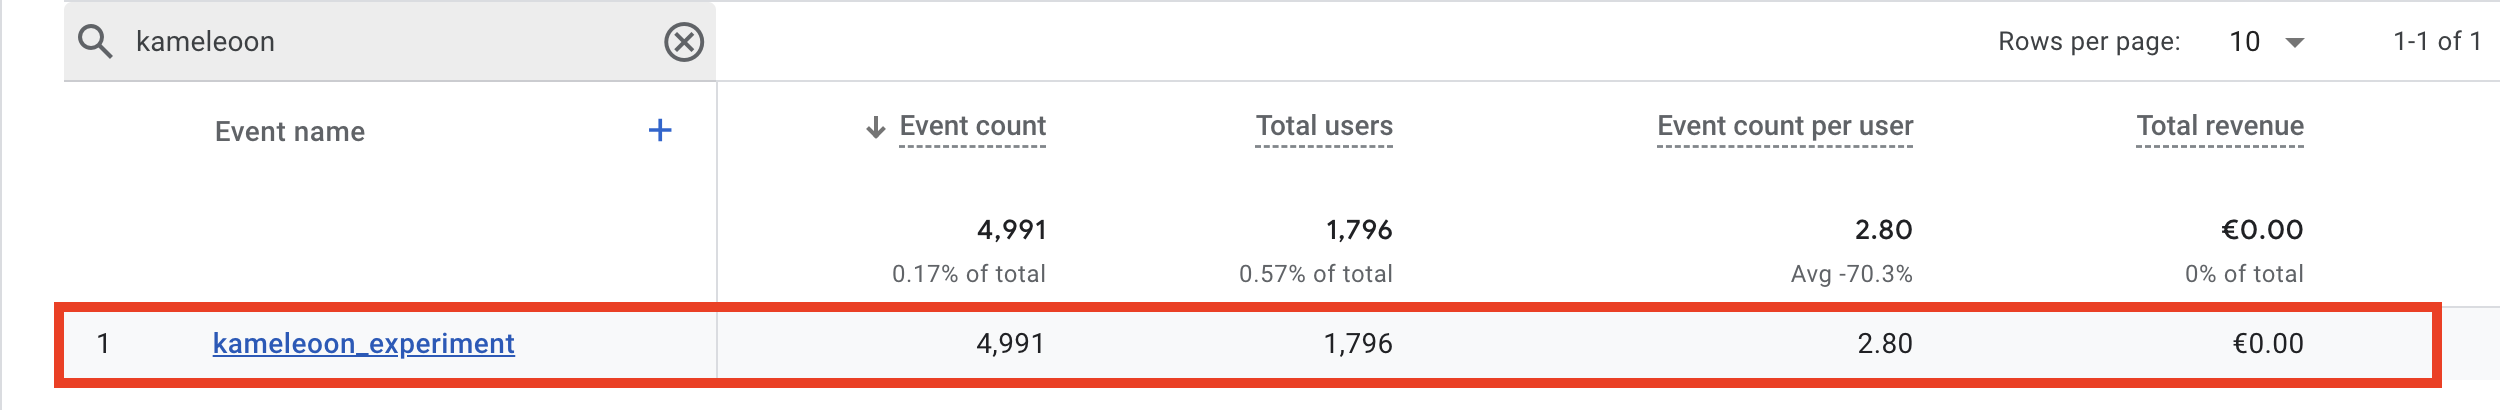
In our example, we can see that there is data corresponding to the A/B Test. If there are no results, check that it's really the event you've set up, or check the configuration of your A/B Test tool.
Now that we have A/B TEST data in our analytics tool, let's connect your tool to BigQuery.
Steps to connect your analytics tool to BigQuery
To export data from your analytics tool, we first need to set up BigQuery to receive the extracted data, in which case we need to configure Google cloud platform.
Whatis Google Cloud Plateform?
Google Cloud Platform (GCP) is a suite of cloud computing services including BigQuery, so you'll need a GCP account if you want to use BigQuery.
To find out more about GCP: Google Cloud Platform presentation.
Here are all the configurations to be set up:
- Create a GCP account
- Create a project
- Setting up a payment account
- Configuring BigQuery
- Configuring the Data Transfer API
Createa GCP account
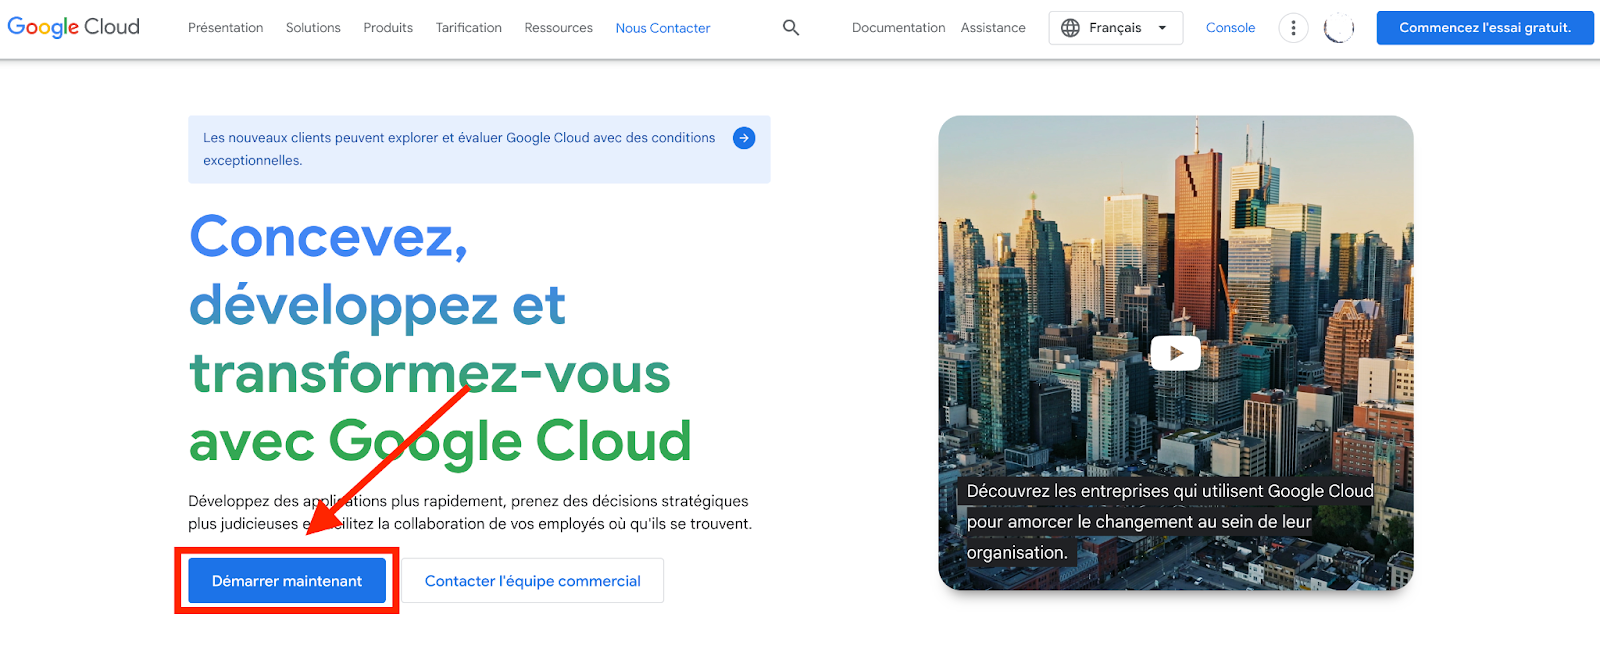
- Create a Google Cloud Platform account:
To do so, go to https://cloud.google.com/?hl=fr, then click on "Start now".
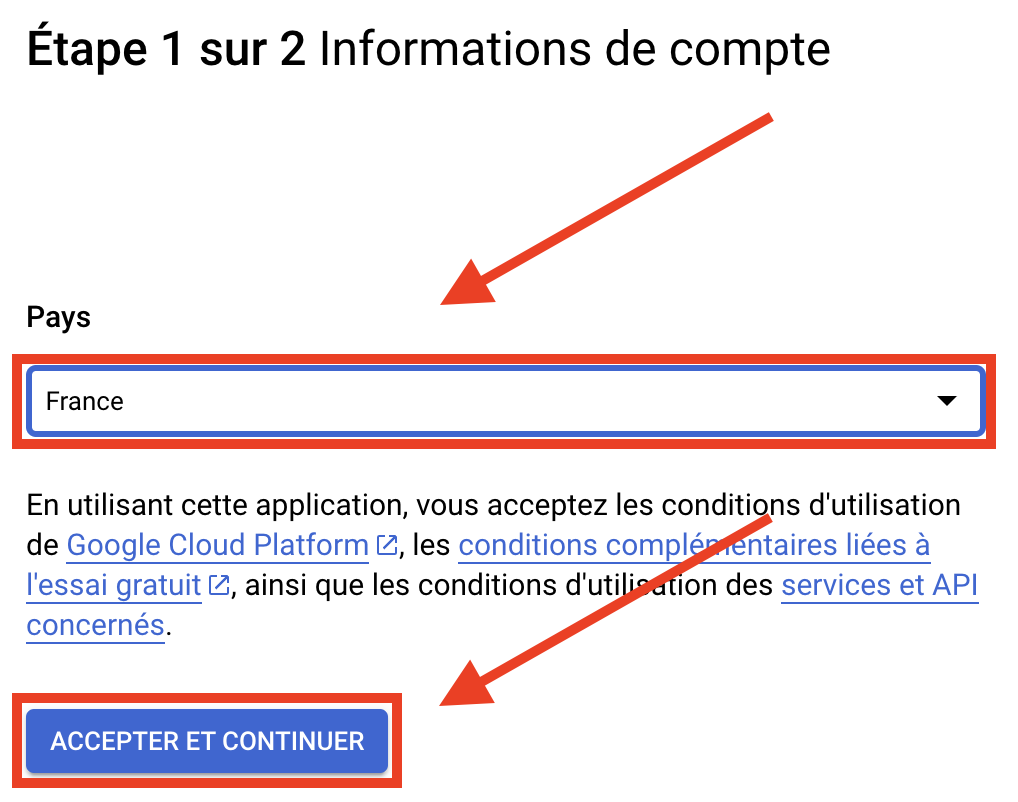
Choose your country then accept.
Enter your payment details.
Click on "Start free trial".

- Create a new project :
What is a project?
A GCP project is a single workspace where your data and applications are centralized, facilitating collaboration and project-specific billing for your entire organization.
This means that you can create a single project, or integrate all your data within it, to make invoicing and organization easier.
To find out more about projects in GCP: Project overview.
If you haven't created a project yet, go to your GCP interface https://console.cloud.google.com/welcome, then click on "New project ".
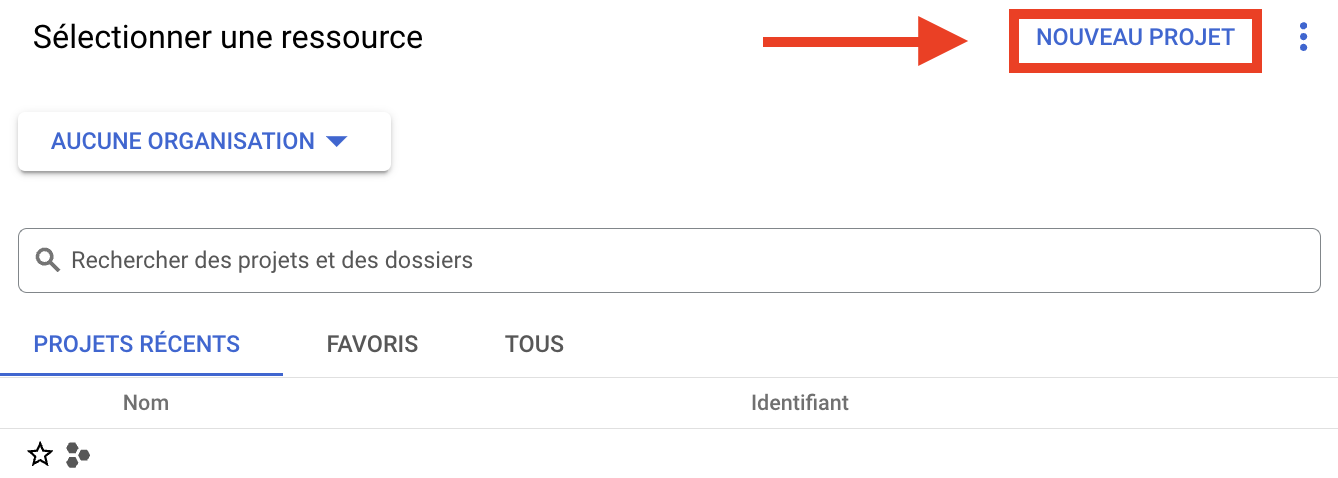
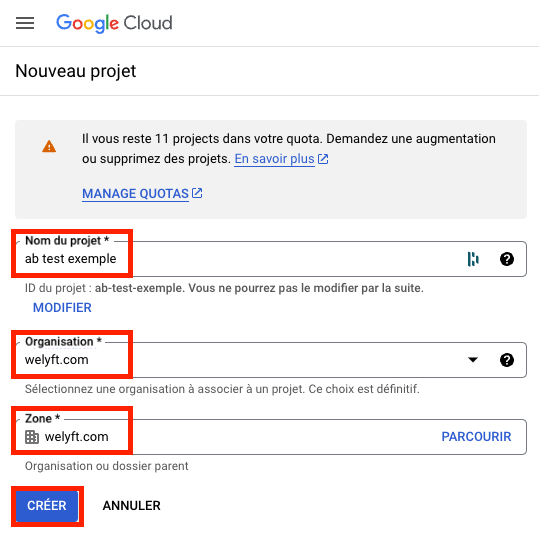
- Fill in your project name, you can take a broad name like your company's name.
- Choose an organization that you configured when you created your GCP account.
- Choose a zone, which corresponds to the folder in which you are integrating your project.
- Then press "Create".
- Billing account for your project:
Whatis a billing account?
A billing account in Google Cloud Platform (GCP) is an entity that manages billing and can be linked to a project to centralize and control all associated costs.
More information on billing accounts: Manage your billing account.
A billing account is required to activate BigQuery's Data Transfer API (we'll explain what the Data Transfer API is next).
How do I create a billing account?
If you've already created one, go here. (link to: How to link your billing account to your project).
If you did not create a billing account during GCP account creation :
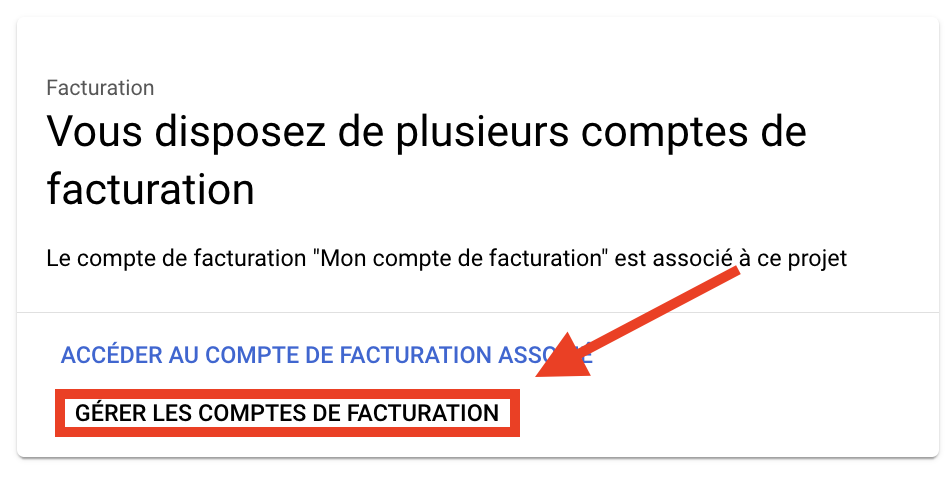
Go to the GCP interface and type "billing account in the search bar", then click on "Billing account".
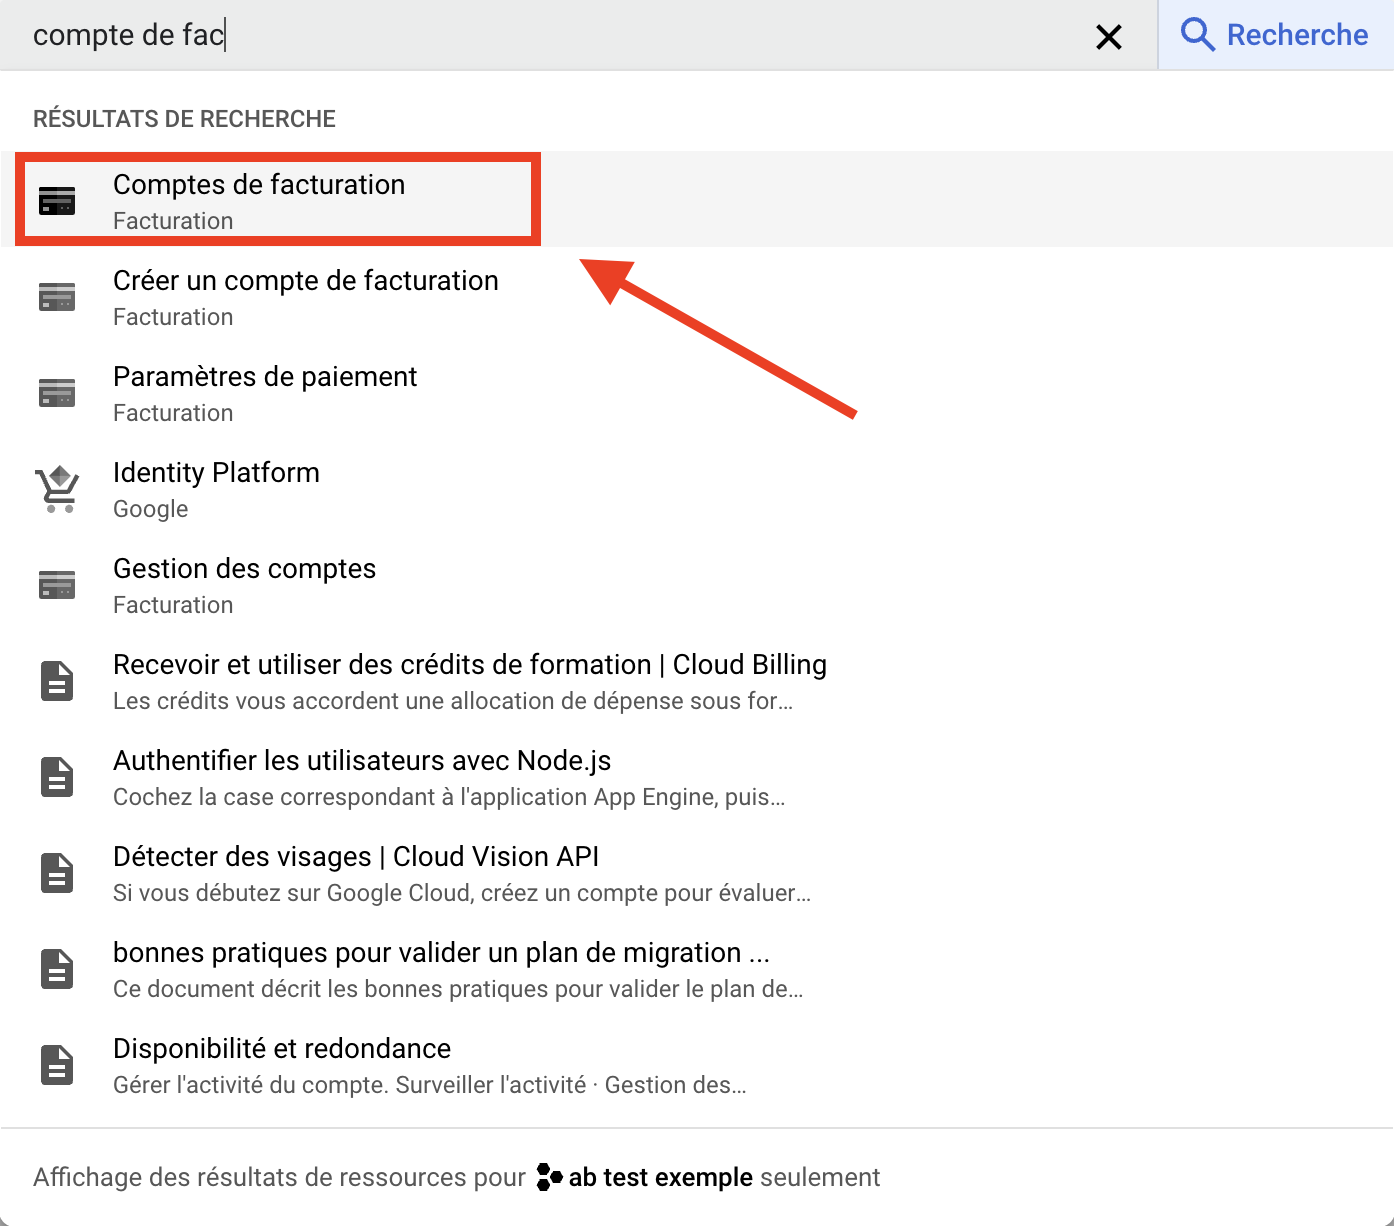
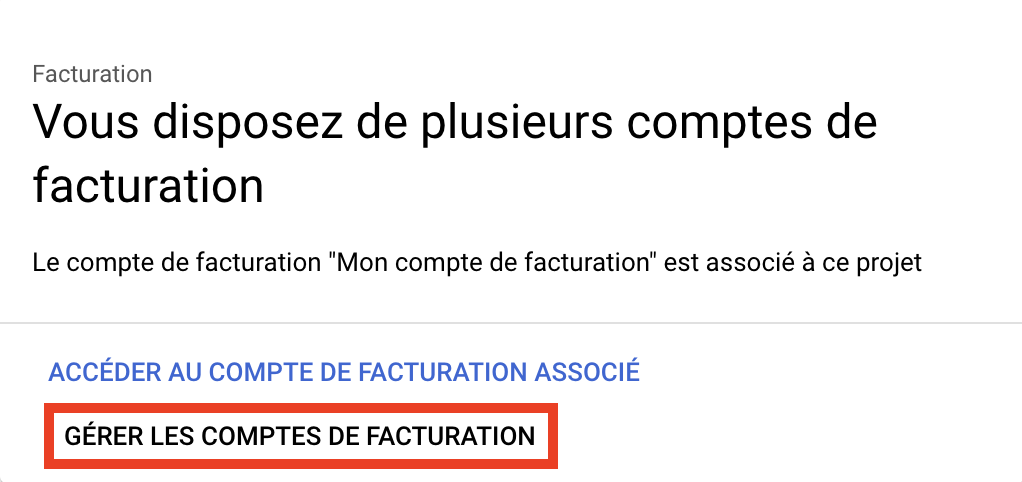
GCP will tell you that "This project has no billing accounts", click on "Manage billing accounts".
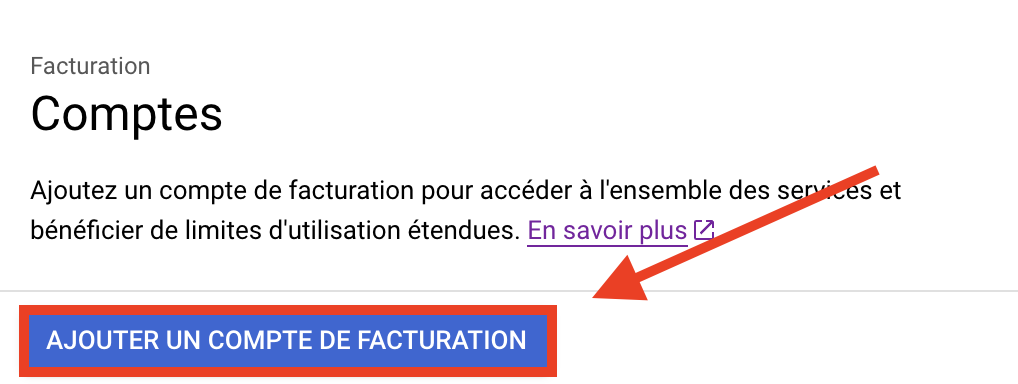
Click on "Add a billing account".
Select your country.

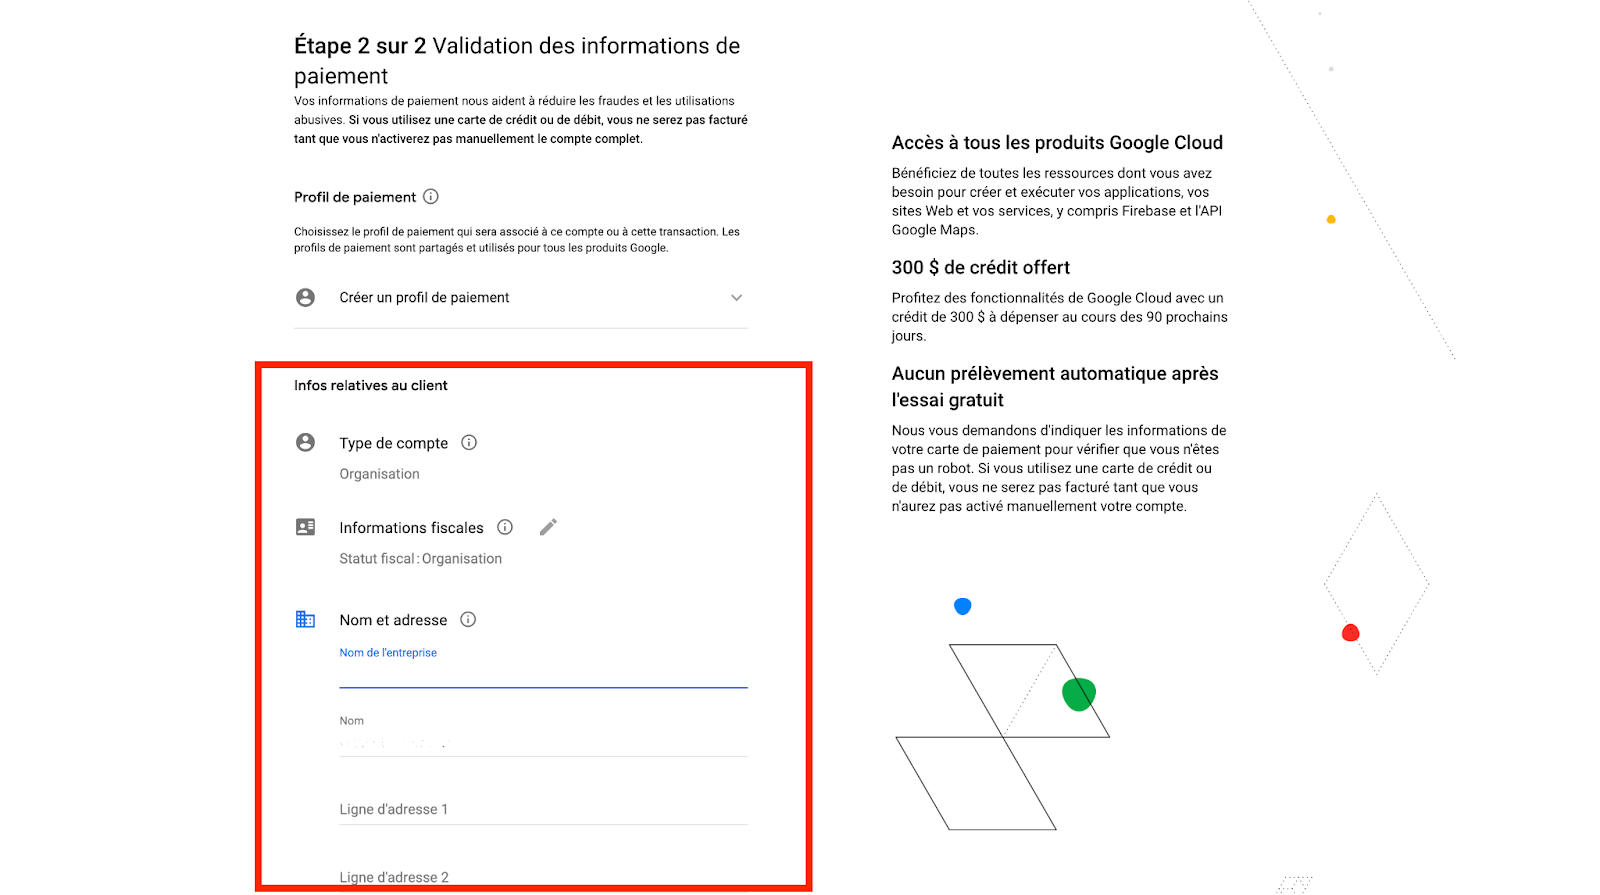
Billing account creation is structured as follows:
- Account type
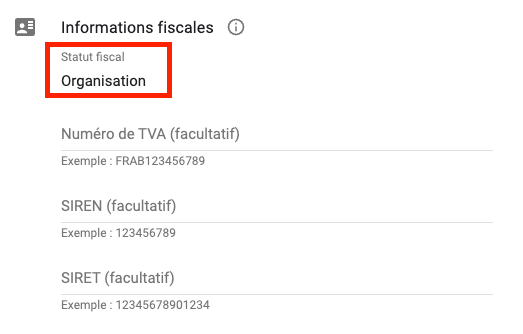
- Tax information
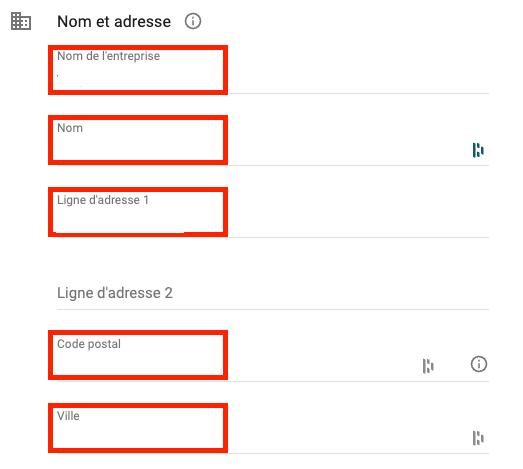
- Name and address
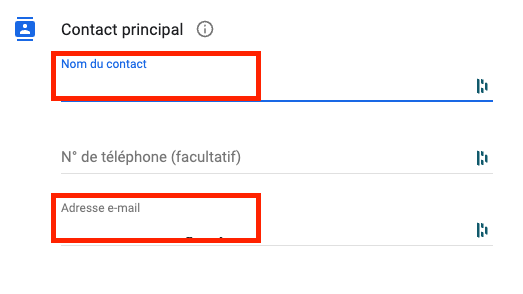
- Main contact
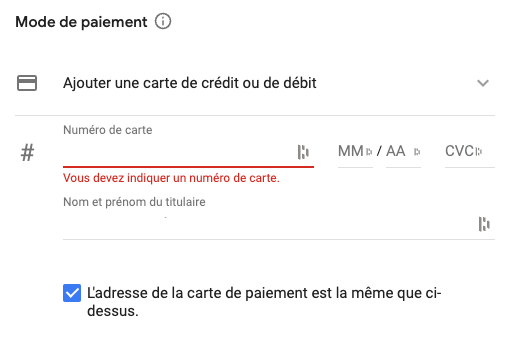
- Payment processing
- Method of payment
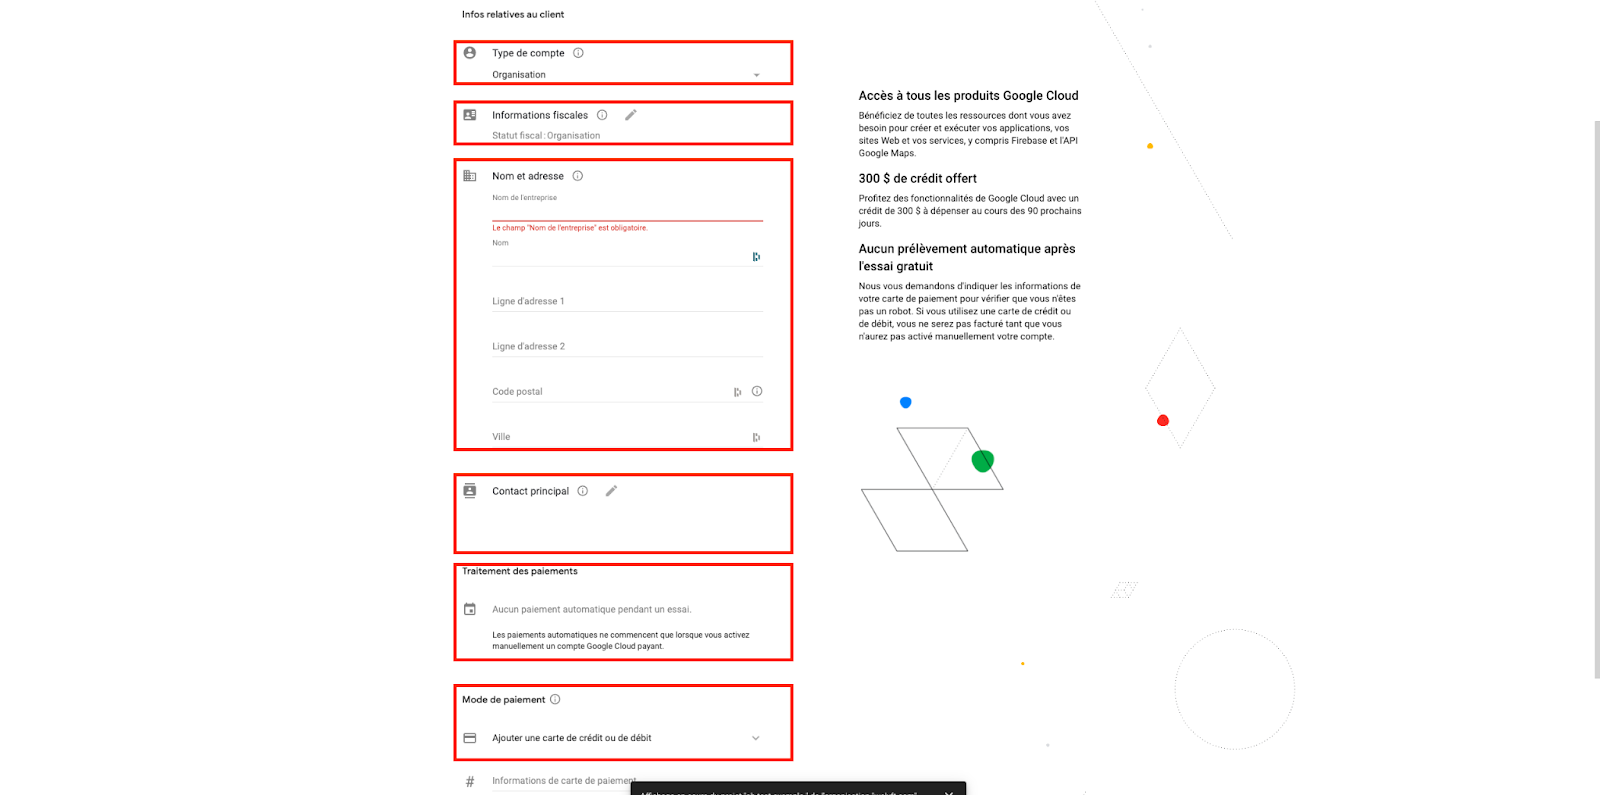
Let's take a step-by-step look at the information you need to fill in.
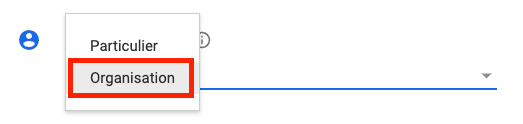
The account type allows you to specify whether you are an individual or a company - in our case, we are an "Organization".
Your tax status is automatically completed according to your previous choice. For tax information, you can simply enter your tax status, the rest is optional.
In name and address, if you are an organization, fill in :
- Your company name.
- Name of legal guardian.
- Address, zip code and city of registered office.
In "main contact": add the contact's name and e-mail address.
As far as payment processing is concerned, you get a free account for 90 days, so you don't have to worry about that. For more information on the GCP trial version: https: //cloud.google.com/free?hl=fr.

Then enter your payment details.
How do you link your billing account to your project?
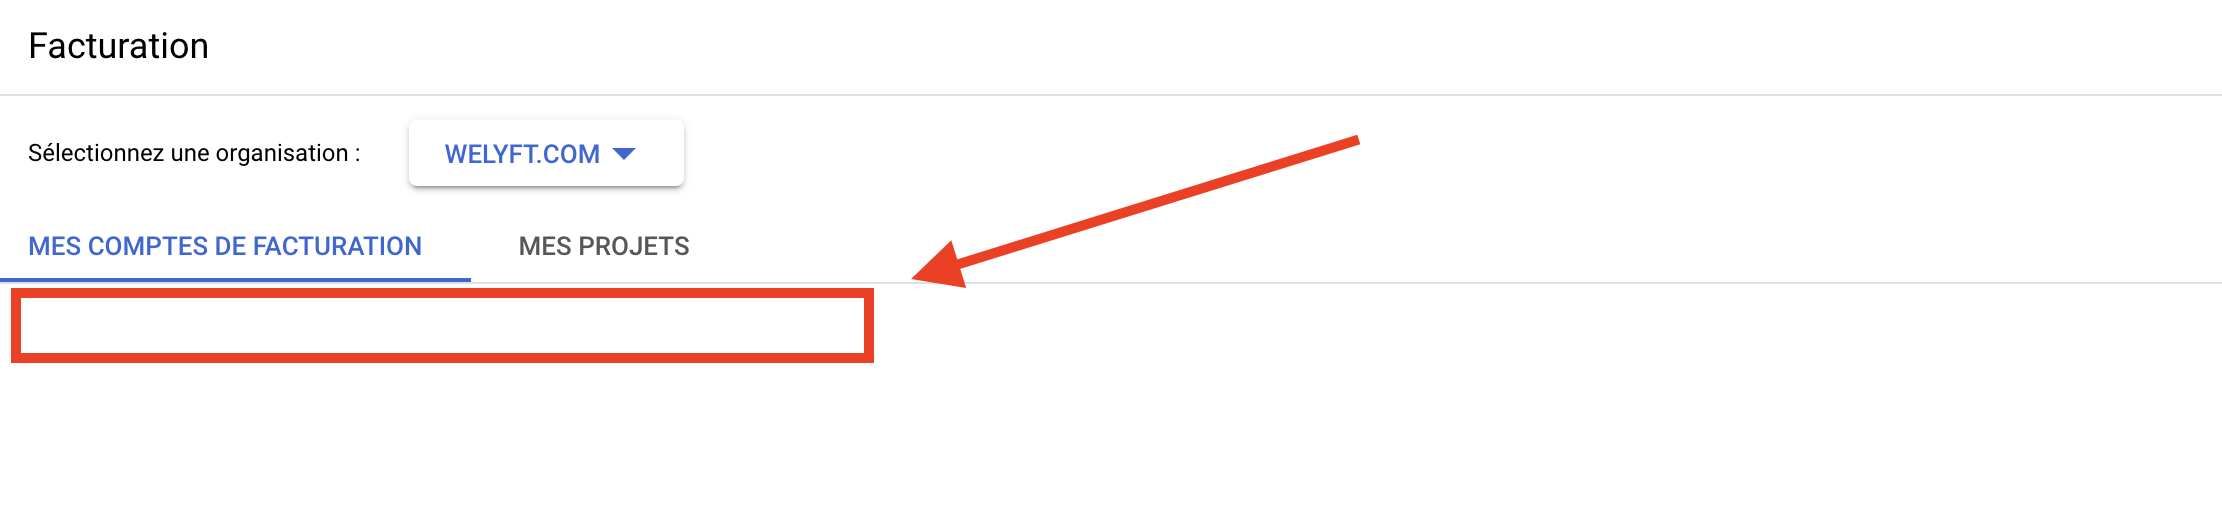
Return to "Manage billing accounts".
Select your organization, then your billing account to associate it with your project.
Once you have a billing account associated with your project, you can activate the BigQuery API to access BigQuery, then the Data Transfer API.
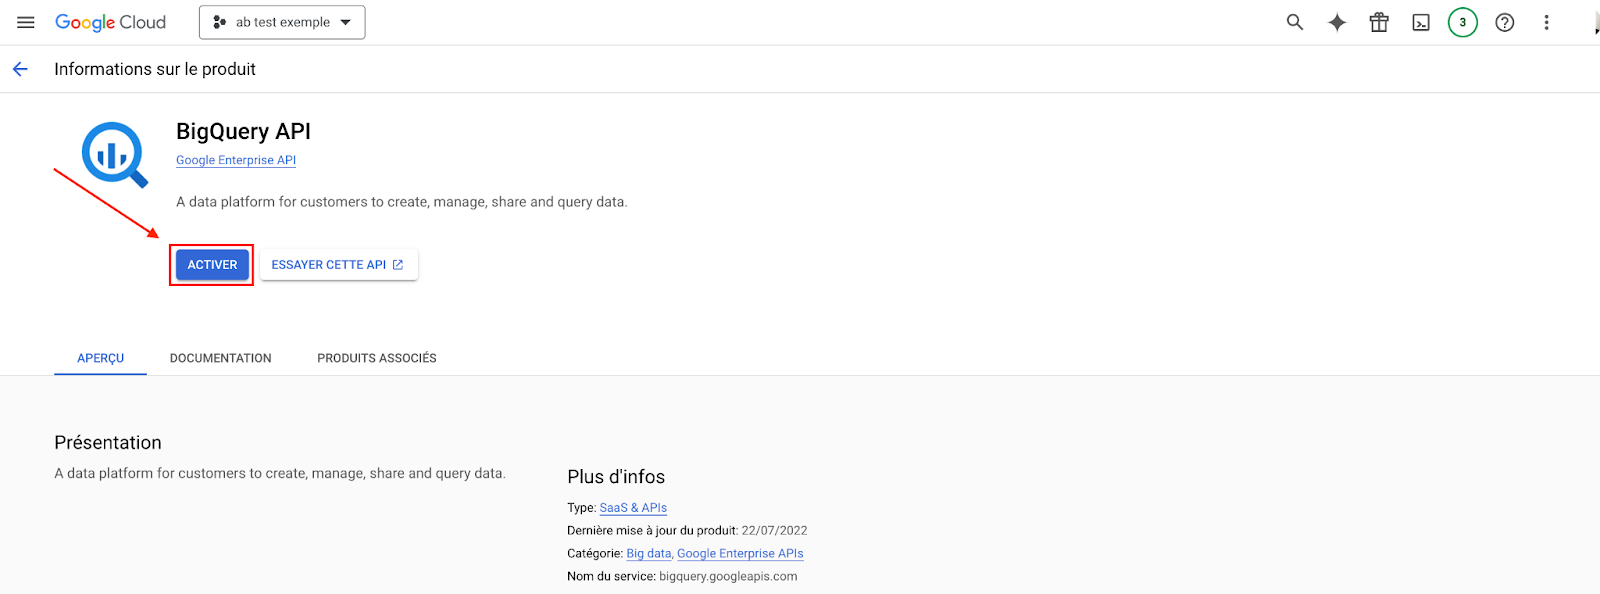
BigQuery API activation
- Activate theBigQuery APIAPI, activation is almost instantaneous.
This gives us access to the BigQuery tool and enables us to receive data.
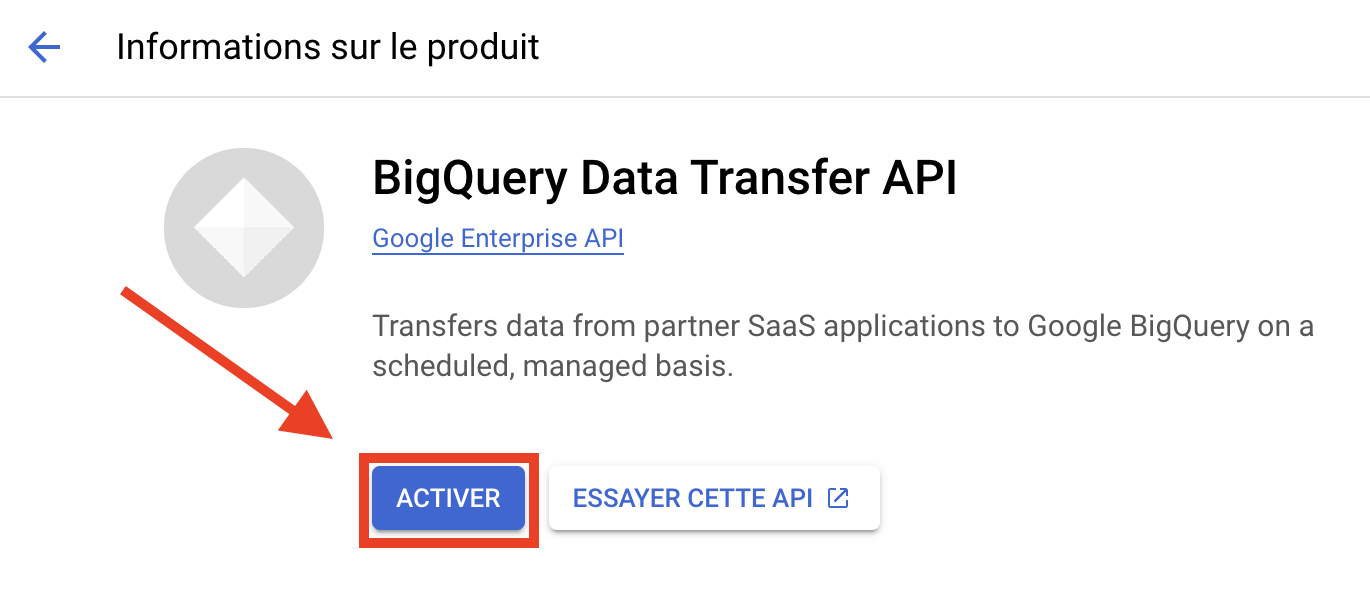
- Activate BigQuery's Data Transfer API:
What is the BigQuery Data Transfer API?
It allows you to :
- Automate data transfer (via queries).
- Manage transfer monitoring.
- Error management.
- Automatic updating of data sets.
In our case, the API will enable us to create automated queries to aggregate A/B Test data and create tables for Looker Studio.
To activate BigQuery's Data Transfer API, go to API Data Transfer then click on "Activate". Activation may take several hours.
Once the API has been activated and everything is in place to process the data, the next step is to export the GA4 data into your BigQuery .
Access your analytics tool and activate BigQuery integration
In GA4
- Log in to your Google Analytics 4 account: https: //analytics.google.com/analytics/web.
- Go to the administration settings and find the "BigQuery Links" option.
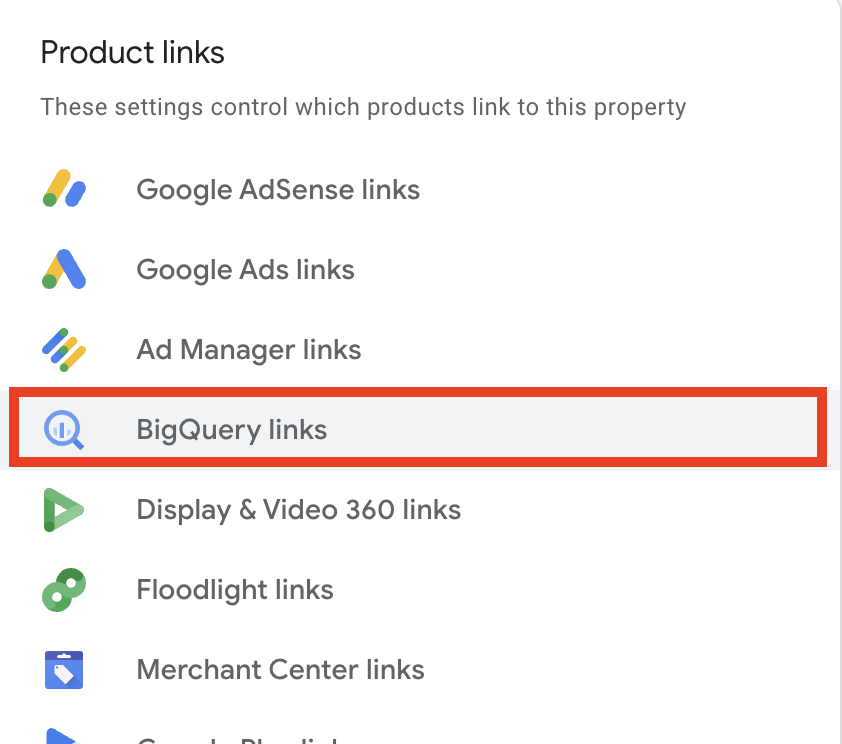
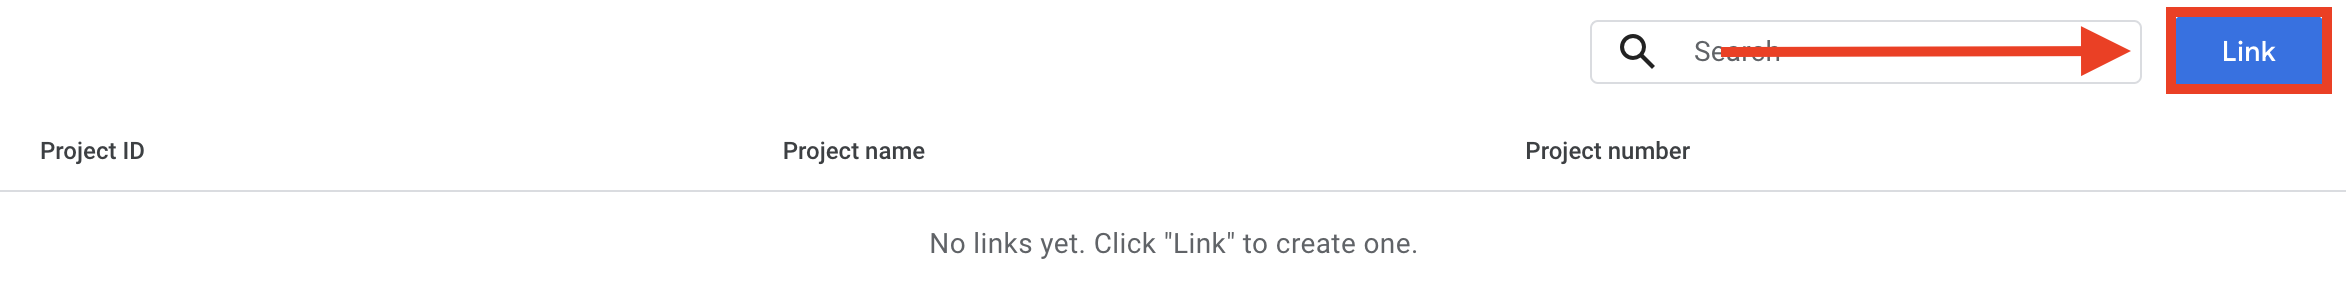
- Click on "Link" to open your BigQuery connector settings.
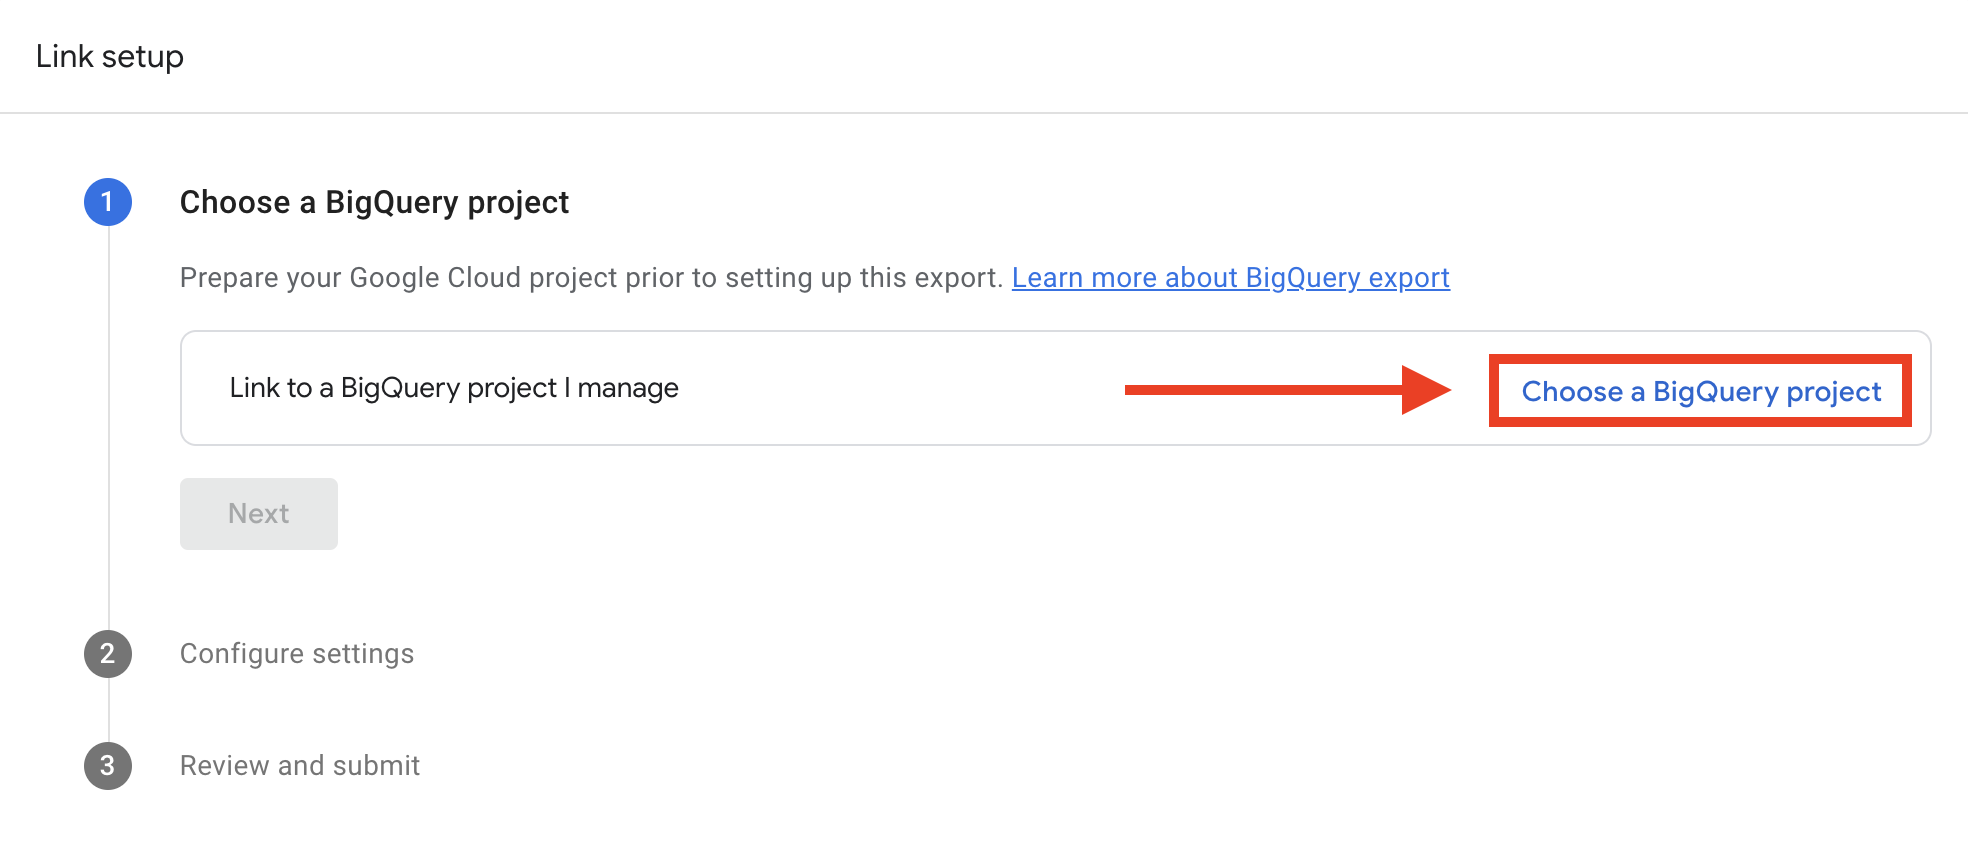
- Click on "Choose a project".
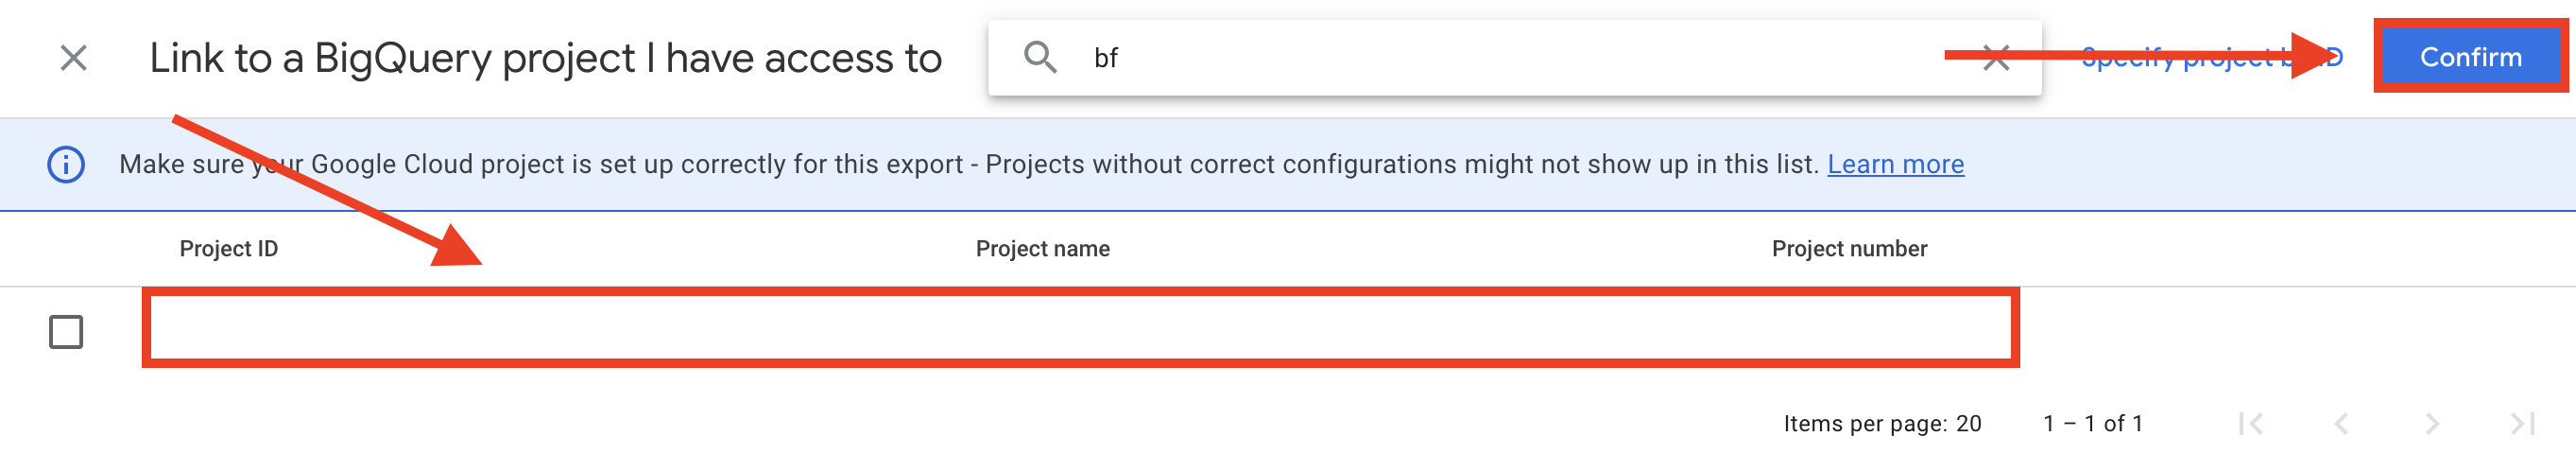
- Choose the project you created earlier in GCP, then click on "Confirm".
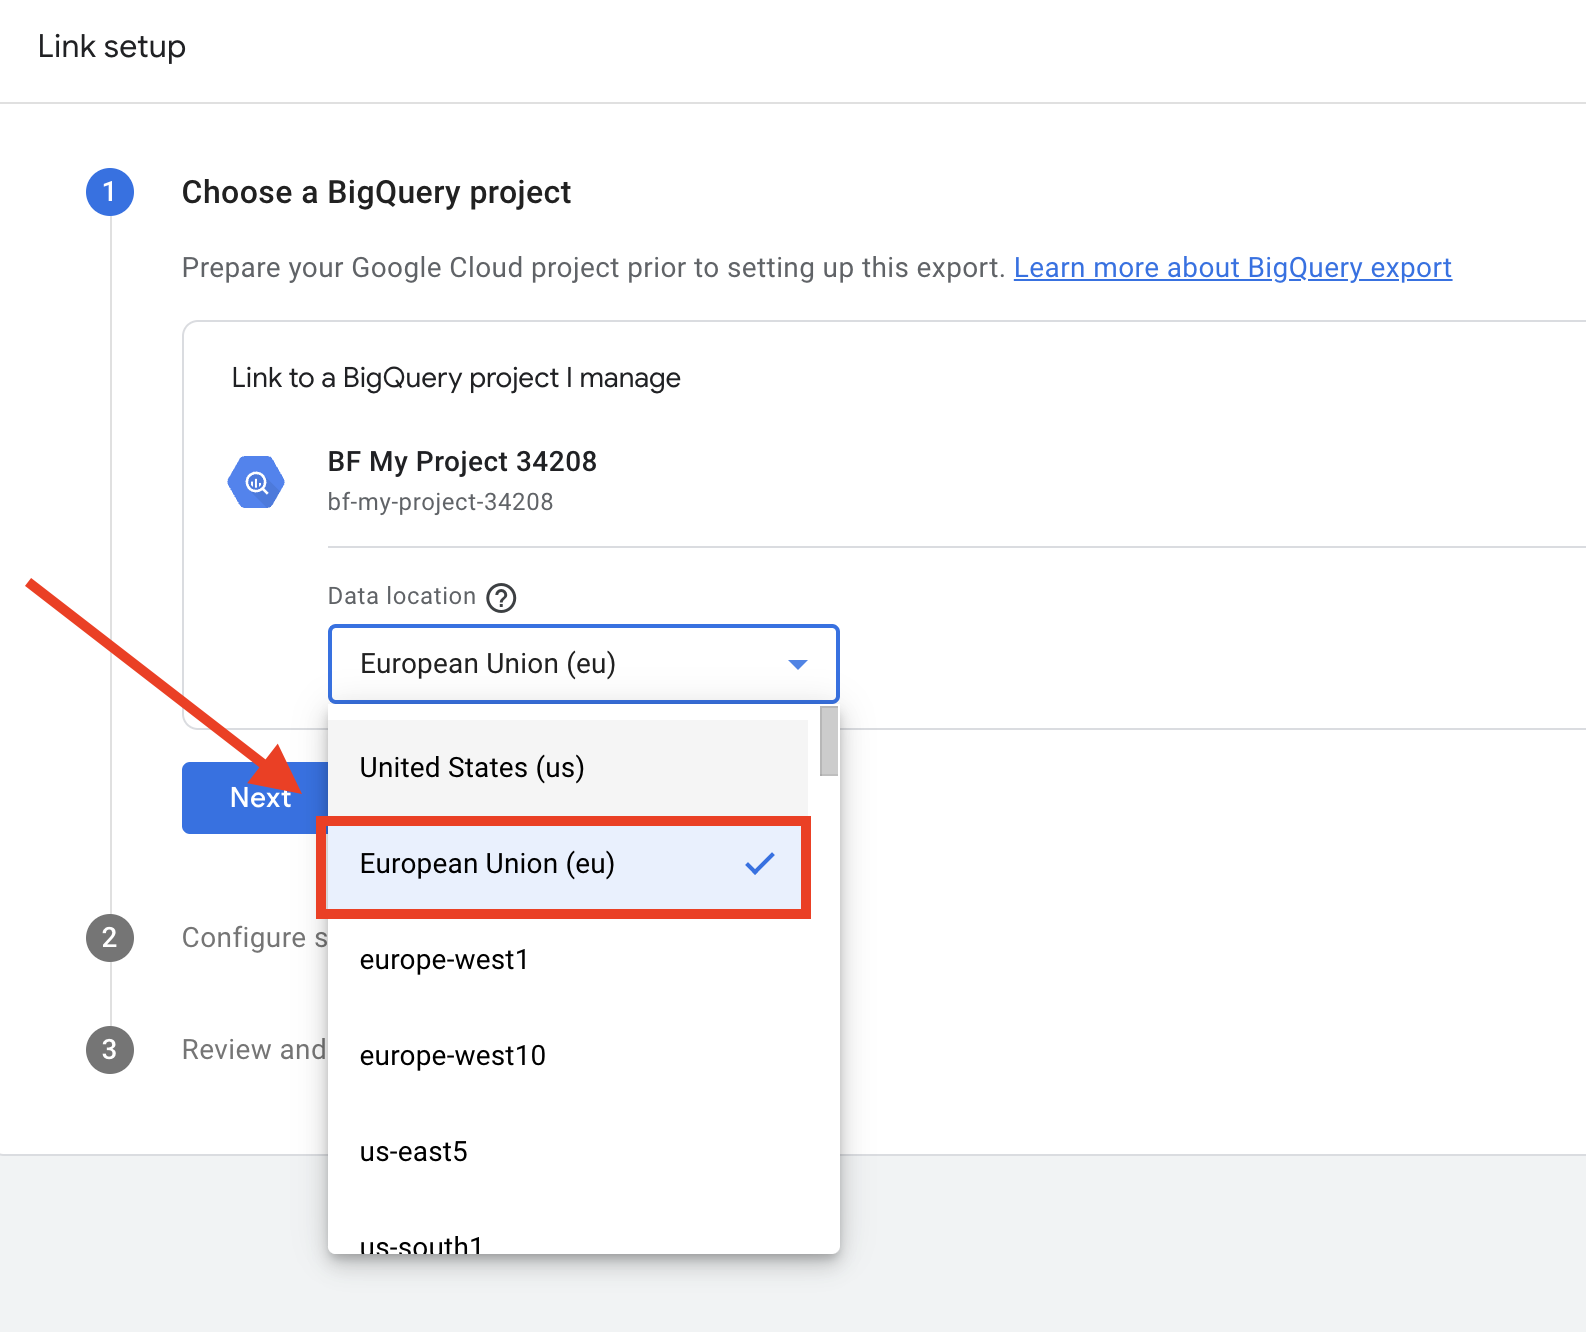
- Choose your data location, select the same location as your project, otherwise the data will not be received, then click "Next".
- Set the frequency by selecting the export type.
There are 2 types of GA4 export to BigQuery:
- Streaming for real-time updates, this option is more expensive.
- As a daily stream, for data transfer once a day .
For more information, here's some documentation on export frequency and price:
In our example, we've chosen daily export, as it's more common, easier to query and less costly.
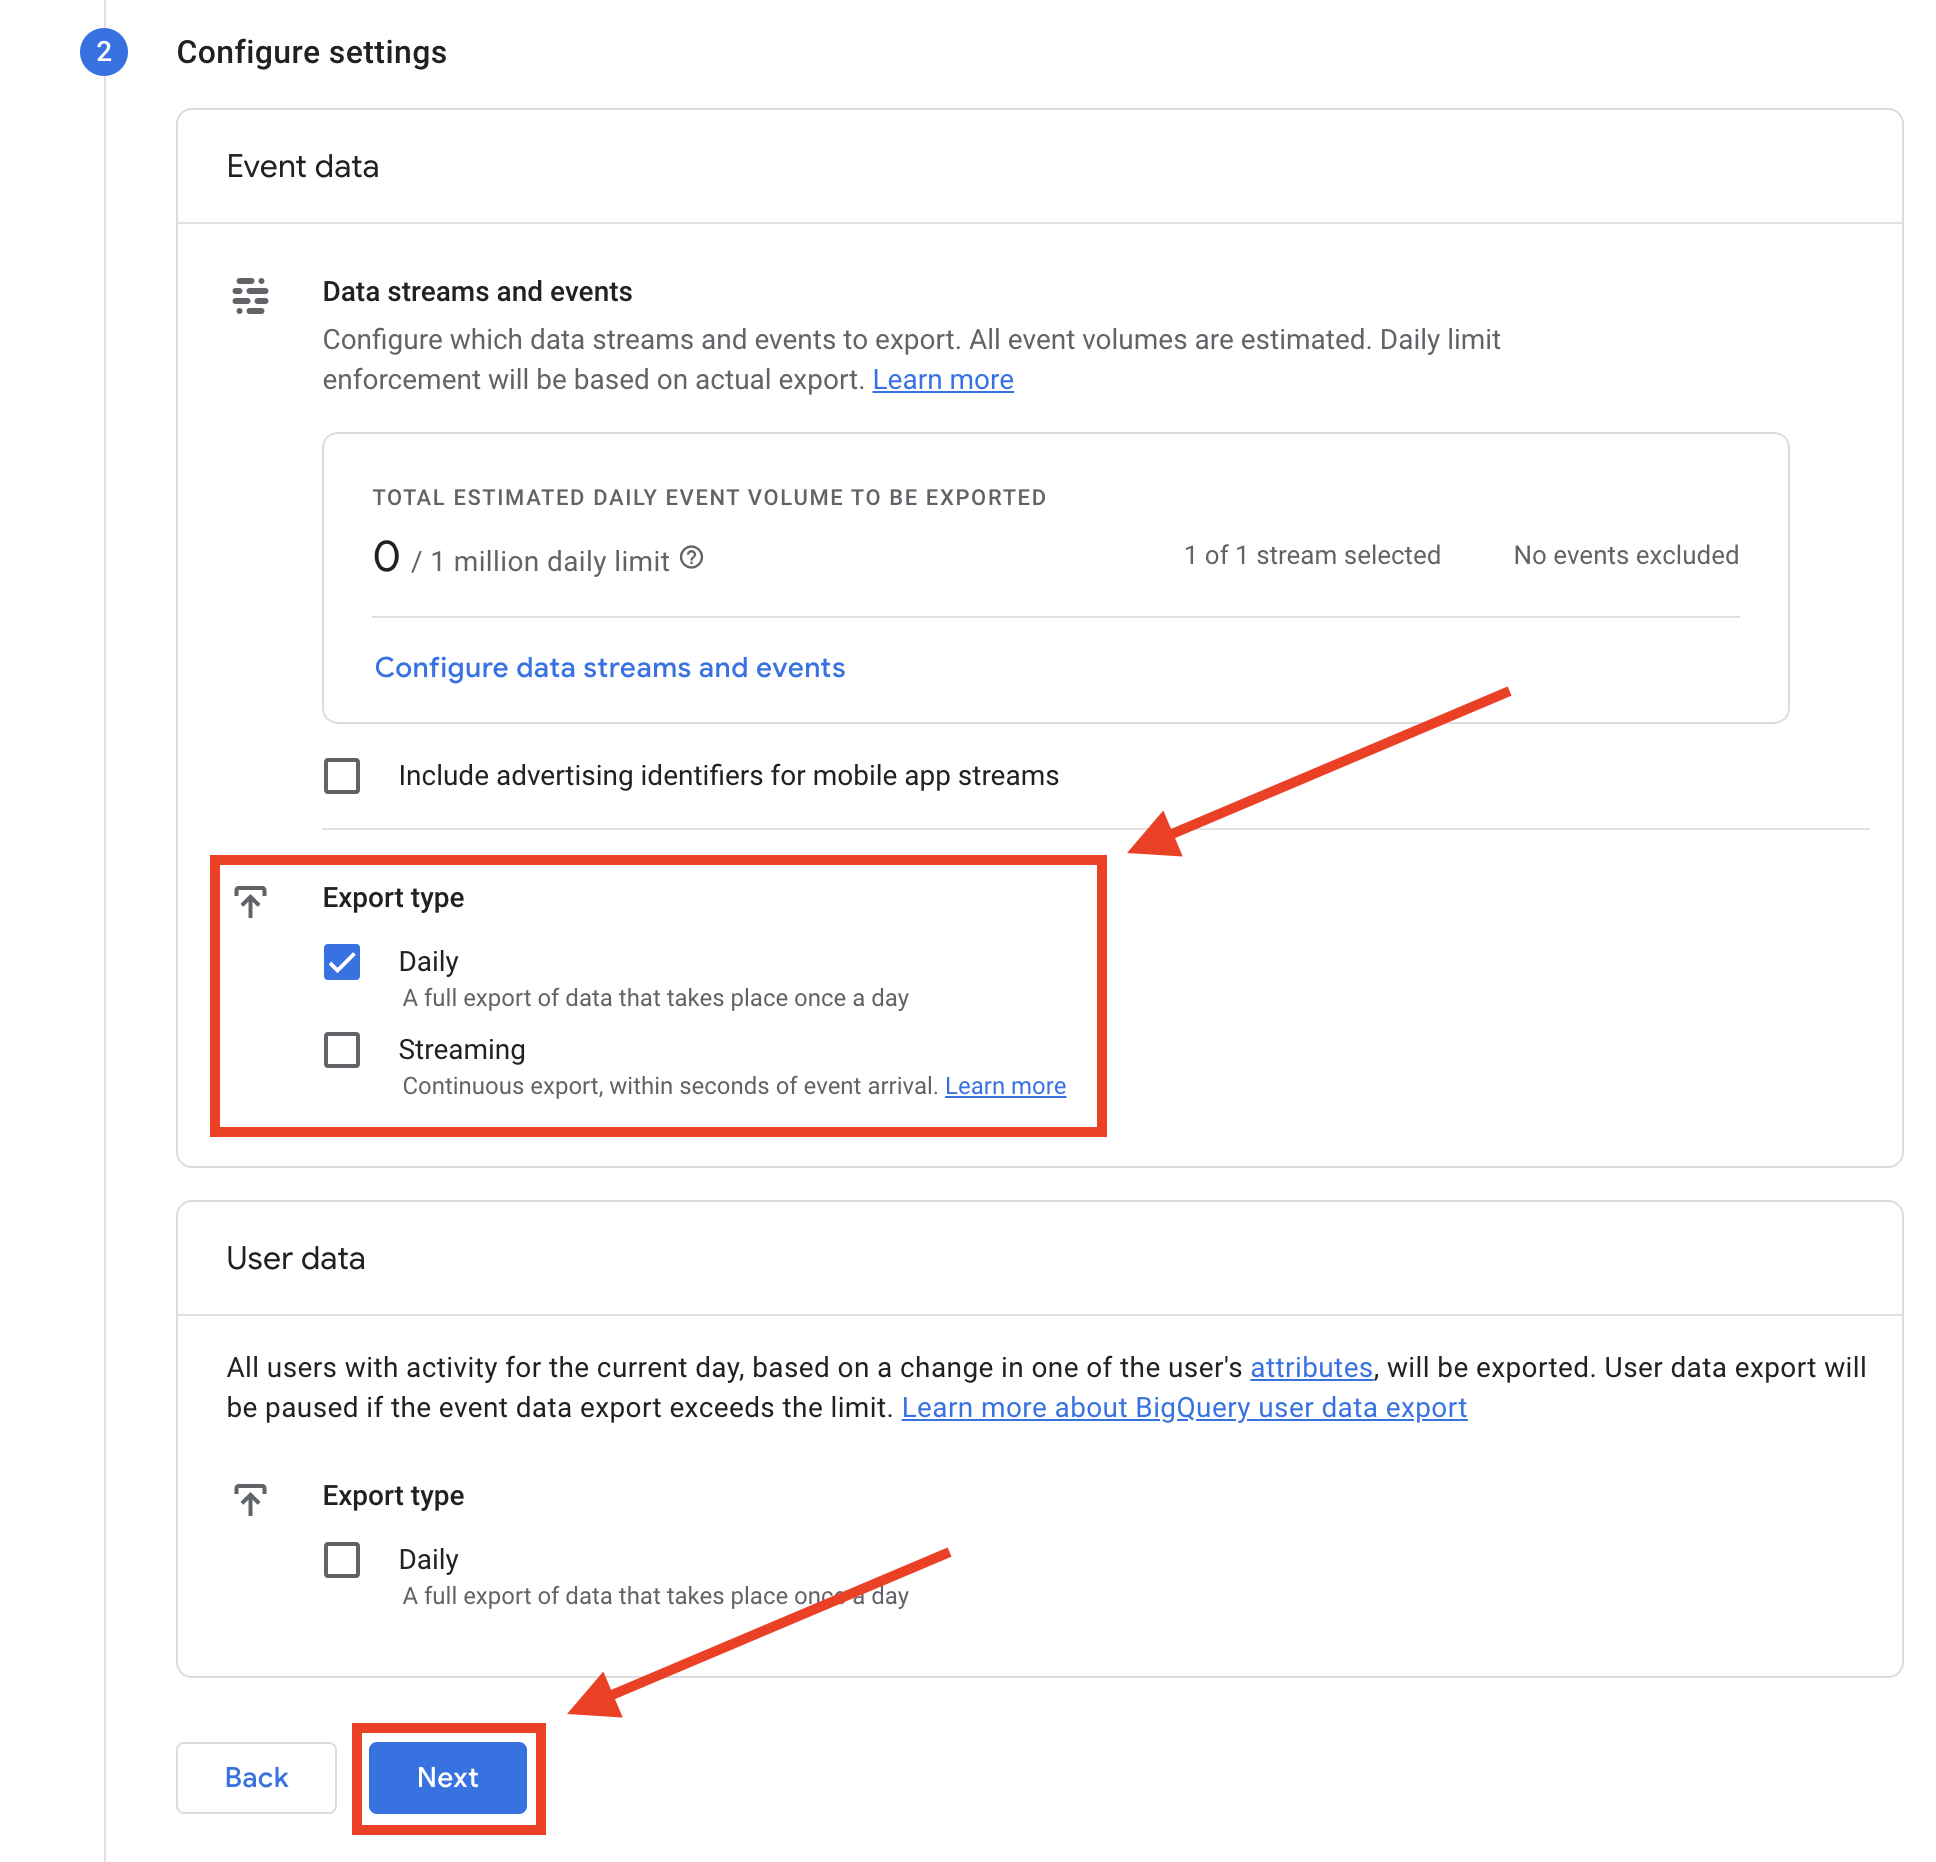
Then click on "Next".
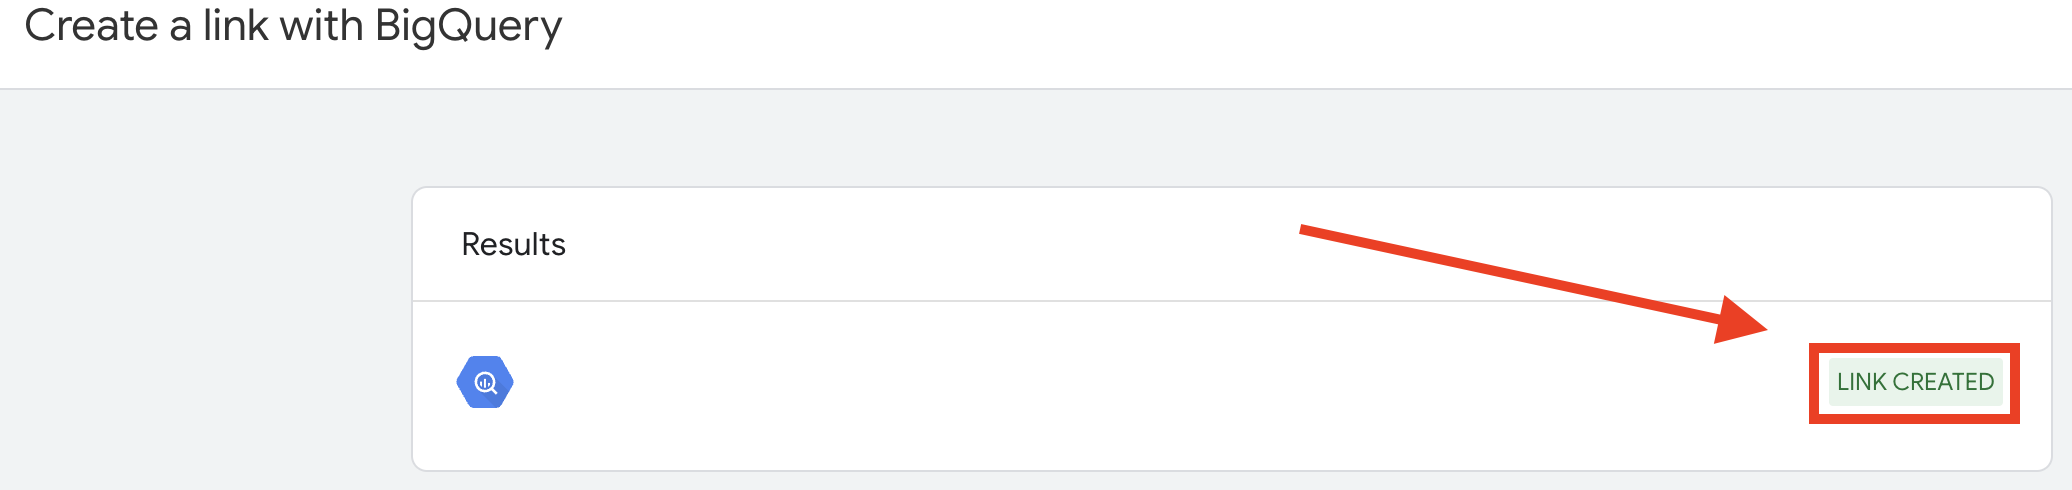
- Once you've created your BigQuery link, you'll see this success message and the name of your BigQuery project.
Once you've created your link between GA4 and BigQuery, return to BigQuery to check that you've received the data.
Check that your event data is correctly exported to BigQuery
- If you have chosen daily export: wait until the next morning.
- If you've chosen streaming export: you can check directly.
We'll now check whether GA4 data is present in BigQuery.
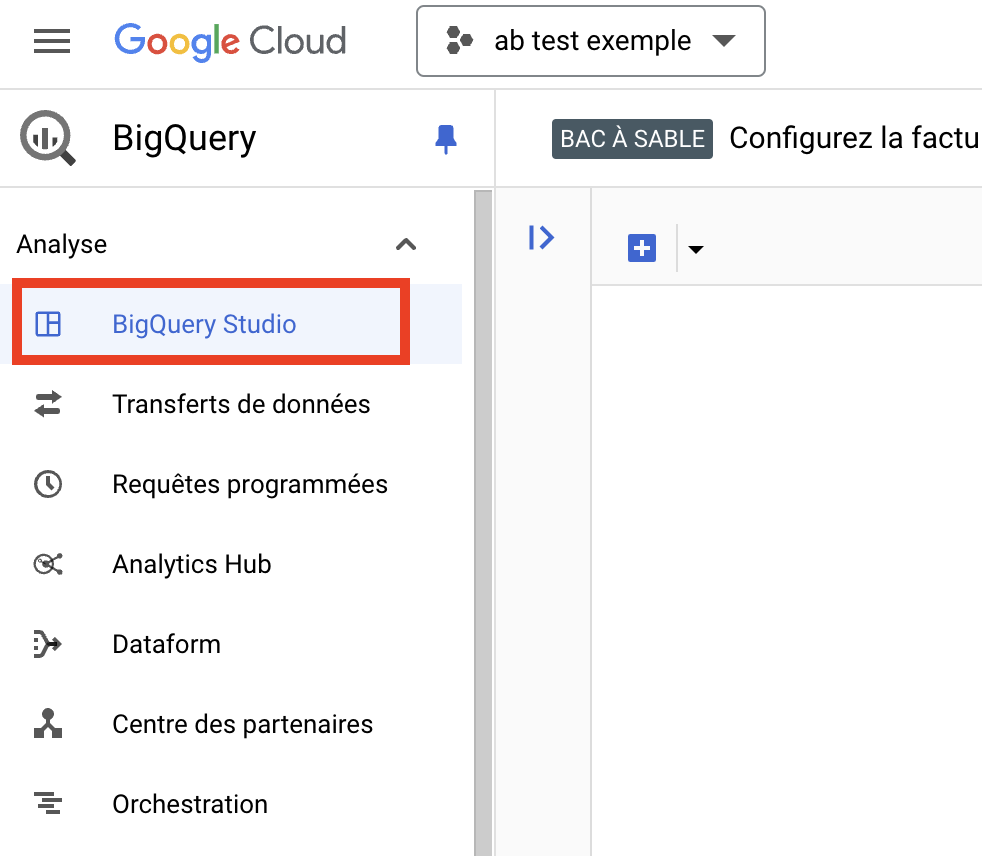
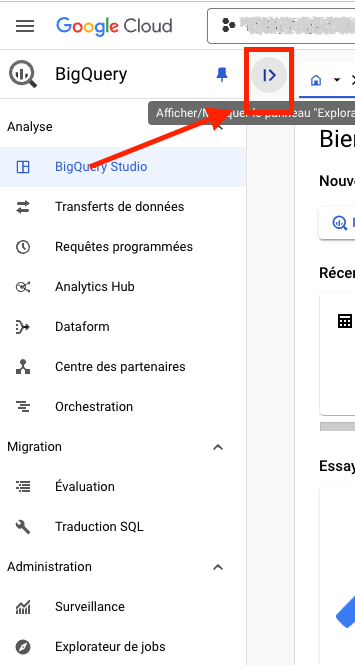
- Go to BigQuery.
- Next, go to BigQuery Studio.
- Display Explorer, the Explorer lets you access all your data sources.
- Check thatthe GA4 dataset is present (it should be automatically added if you've created the GA4 BigQuery connection), and that its name starts with "analytics_".
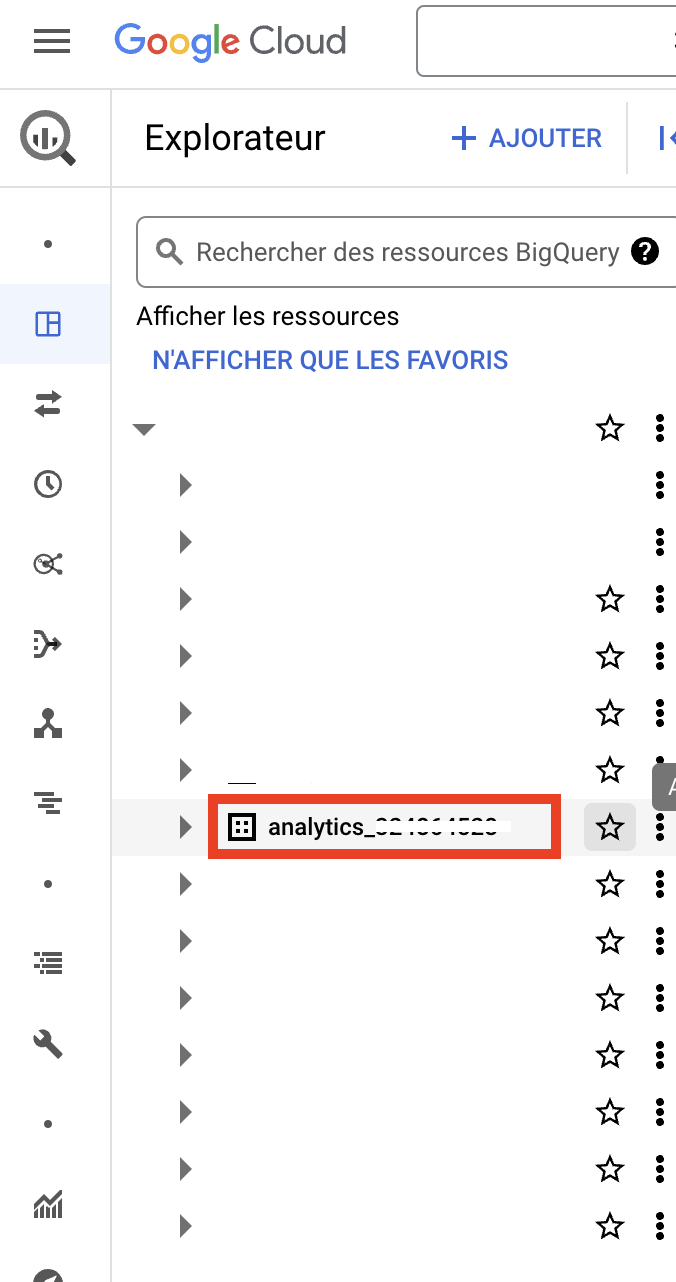
- Once the verification is complete, click on the arrow to expand the node, and the "events_" table will be displayed.

- Click on it to display all table parameters.

- Then click on "preview", which will bring up a preview of all your data to check that you have your GA4 data.
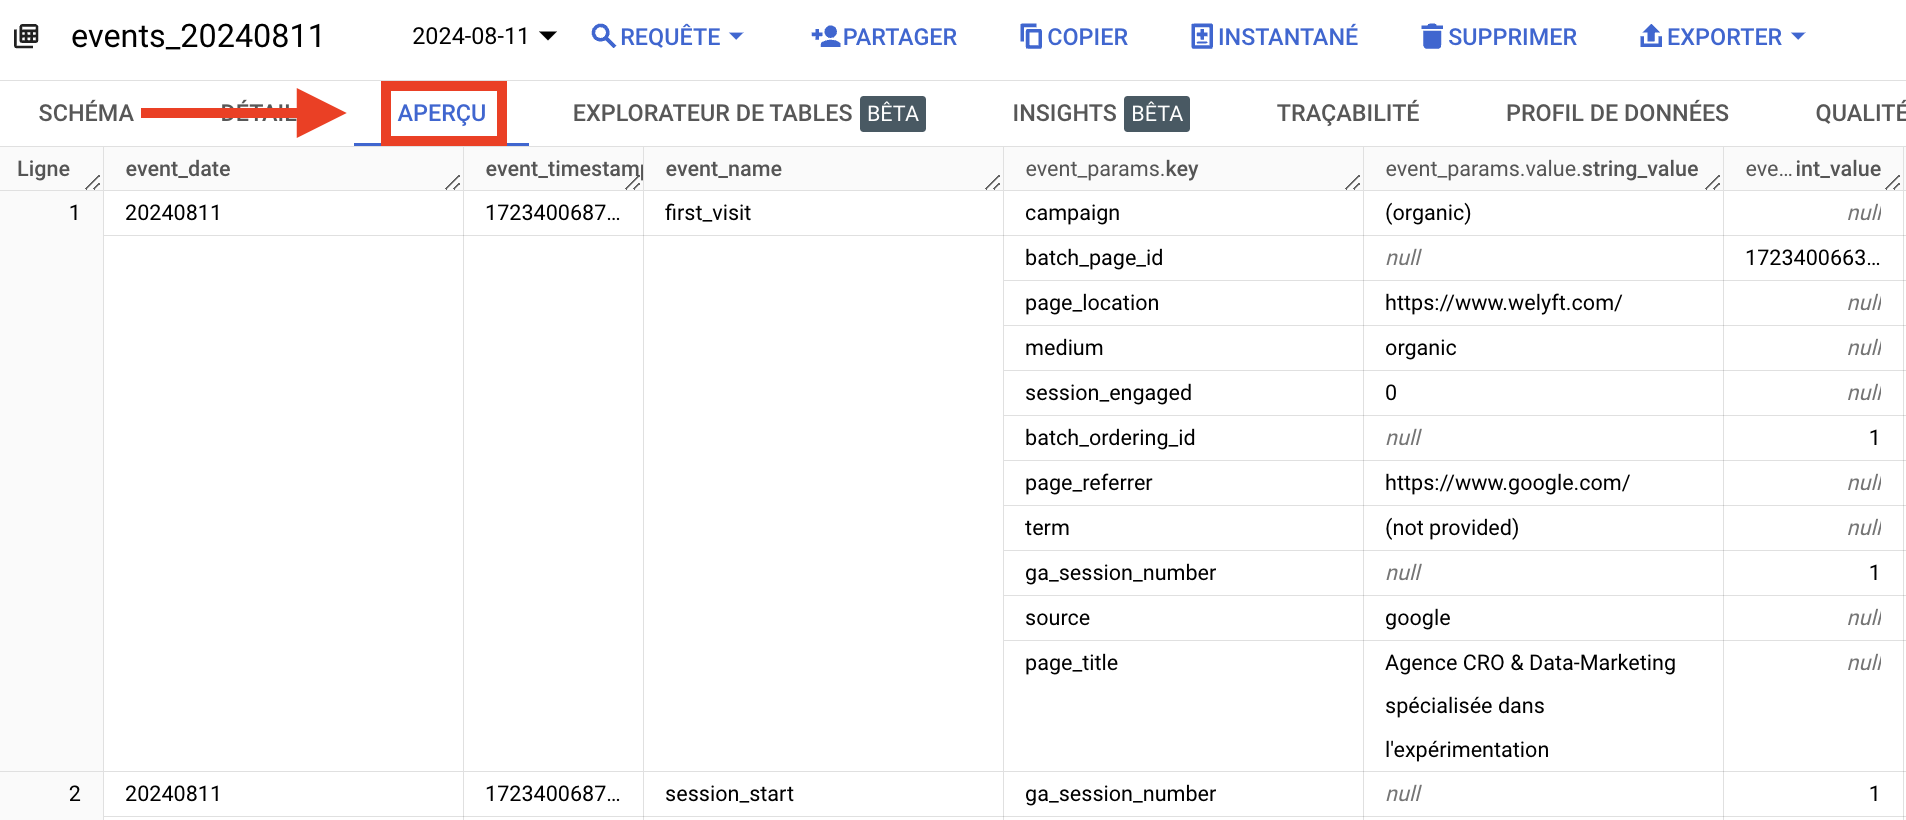
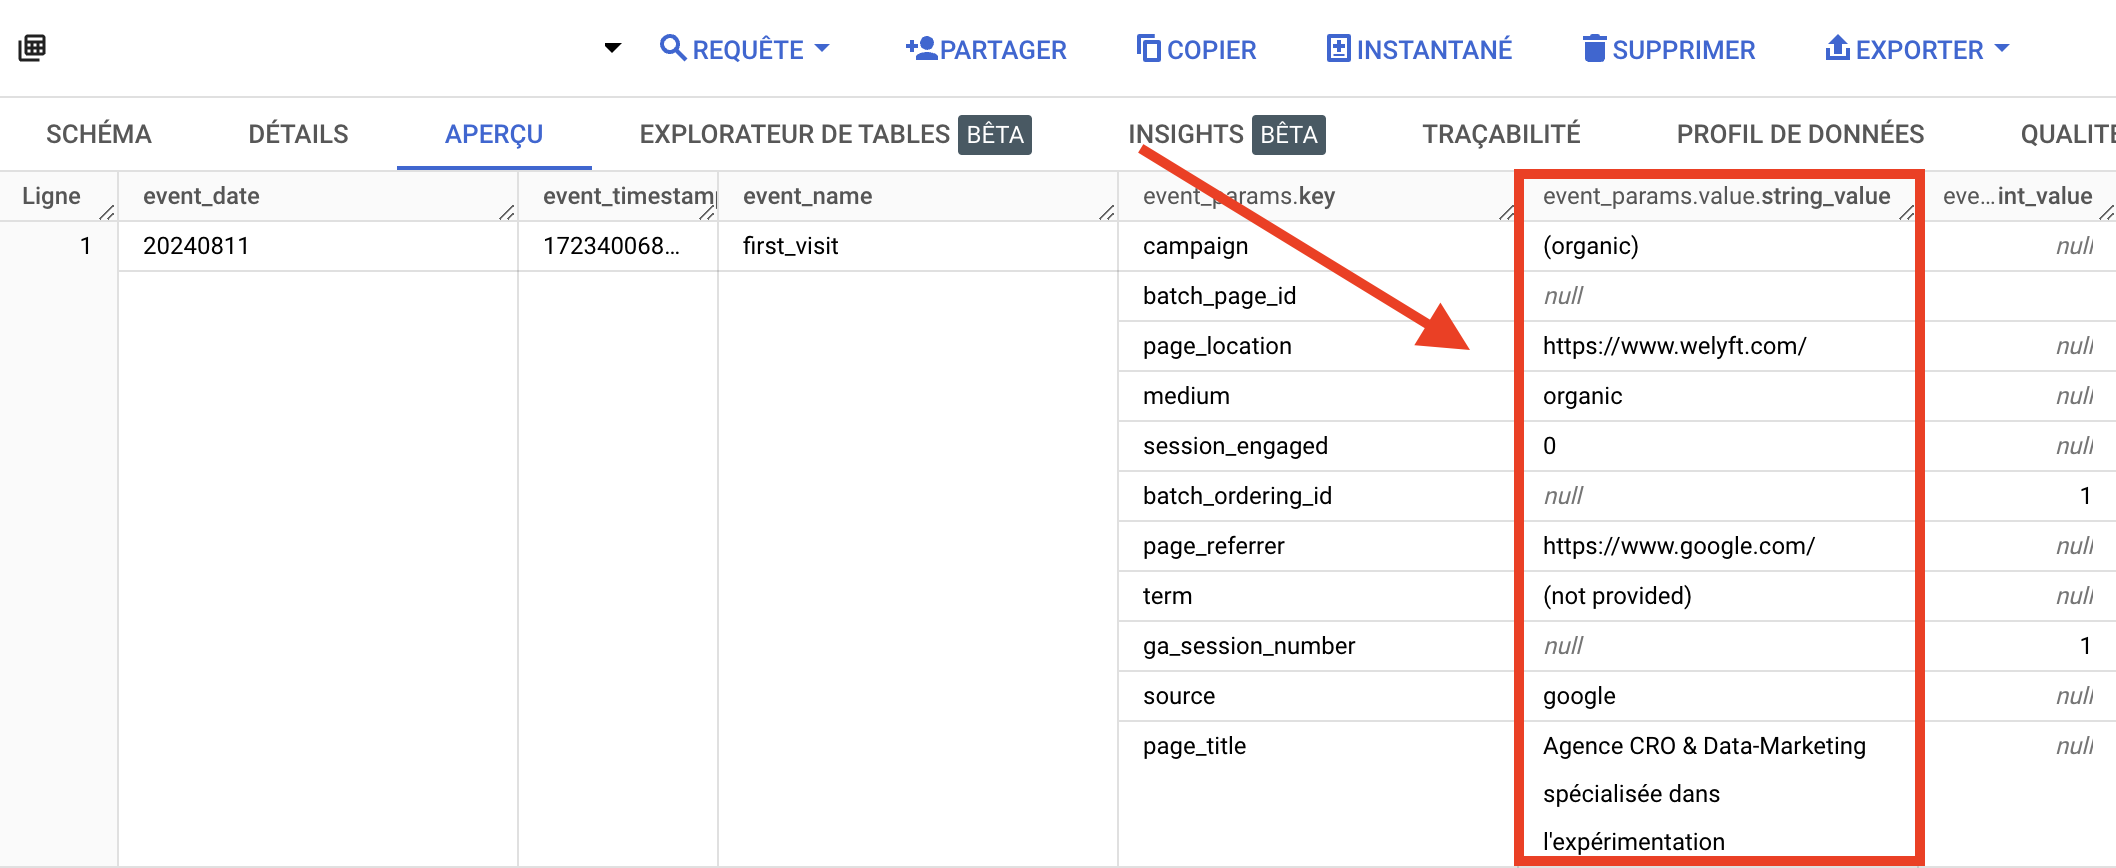
For information, GA4 uses an event-based structure, where each user interaction is recorded as an event with additional parameters to provide contextual details, in our situation this structure allows dimensions and metrics to be created from event parameters.
You can see that the GA4 data has the following structure:
- Evenent_name: event name
- event_params.key: name of event parameter
- event_params.value.string_value: parameter value in string format (a character string)
- event_params.value.int_value: parameter value in int format (numerical values)
The event_params.key column corresponds to the event parameters, used to define the dimensions you need for your analysis.
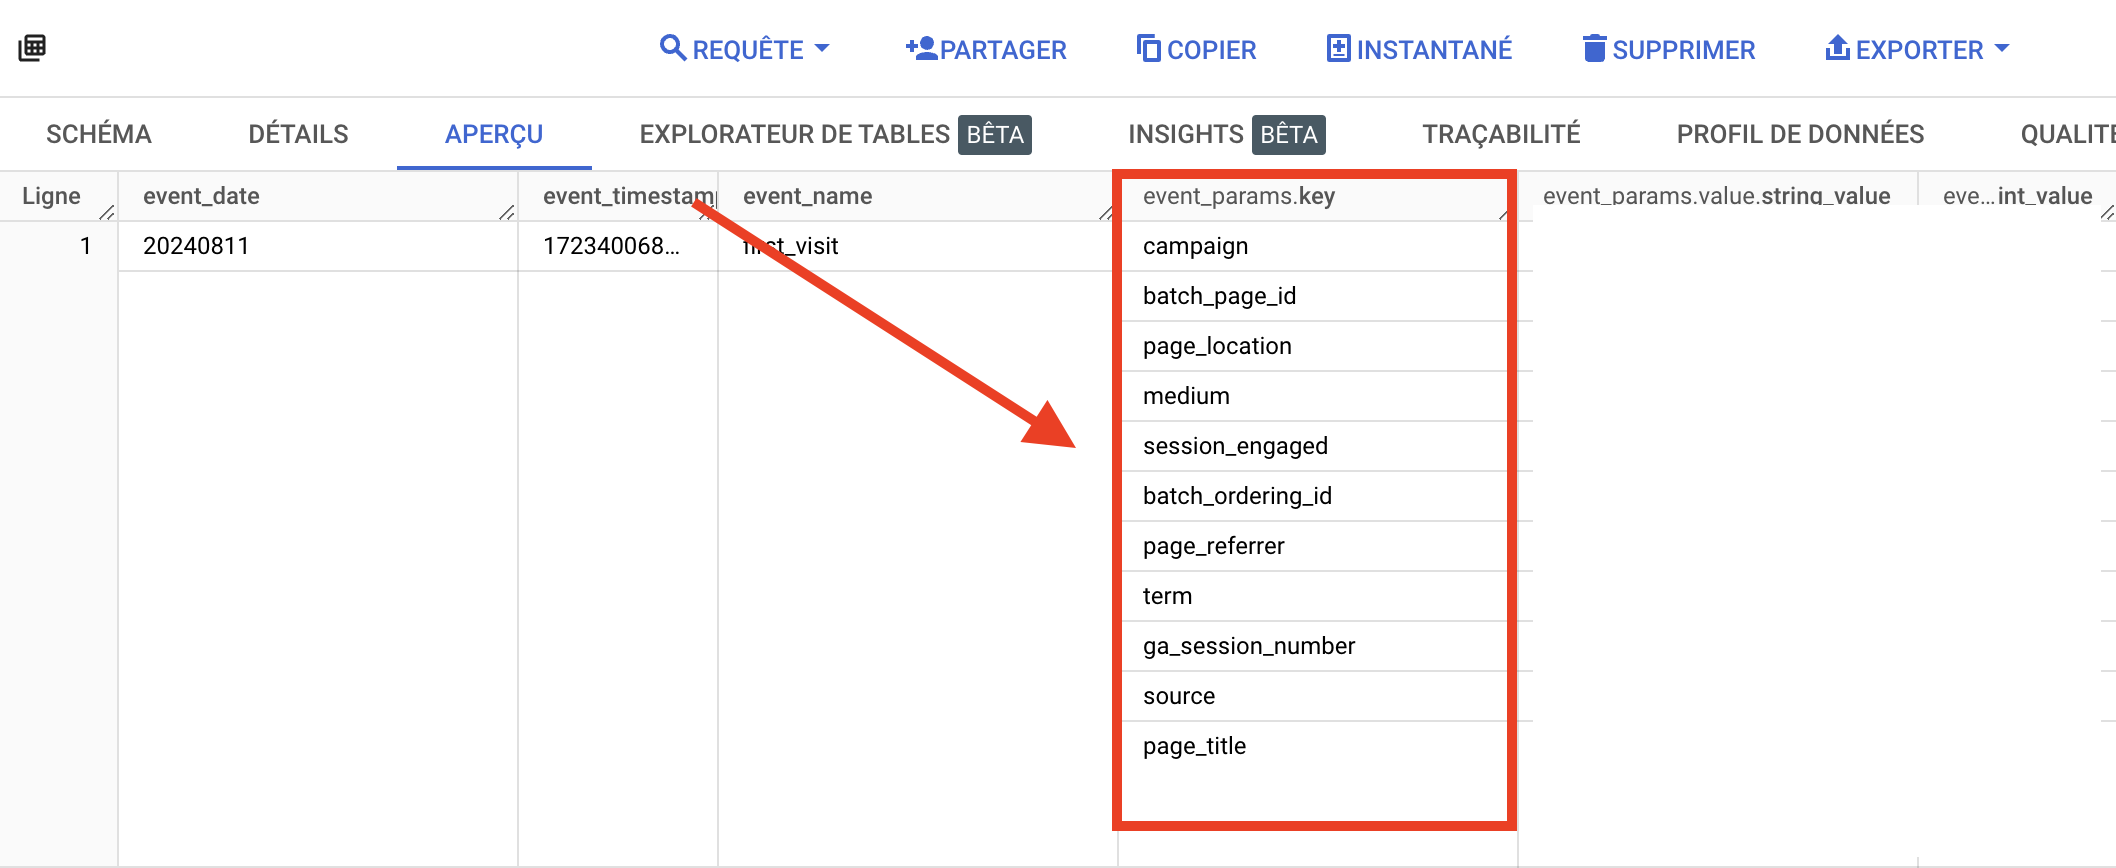
The event_params_value columns are the values of the various parameters.
Now that you have GA4 data in your BigQuery, let's process the A/B Test data from this GA4 dataset.
Exploiting A/B TEST data in BigQuery
Understanding A/B Test events in BigQuery
In our example, we want to exploit Kameleoon's A/B test data.
Before processing the data, we need to analyze what is usable in our A/B Test events for the GA4 export.
We're going to write an SQL query to target A/B Test events via filters.
- Go to BigQuery, then click on "SQL REQUEST".
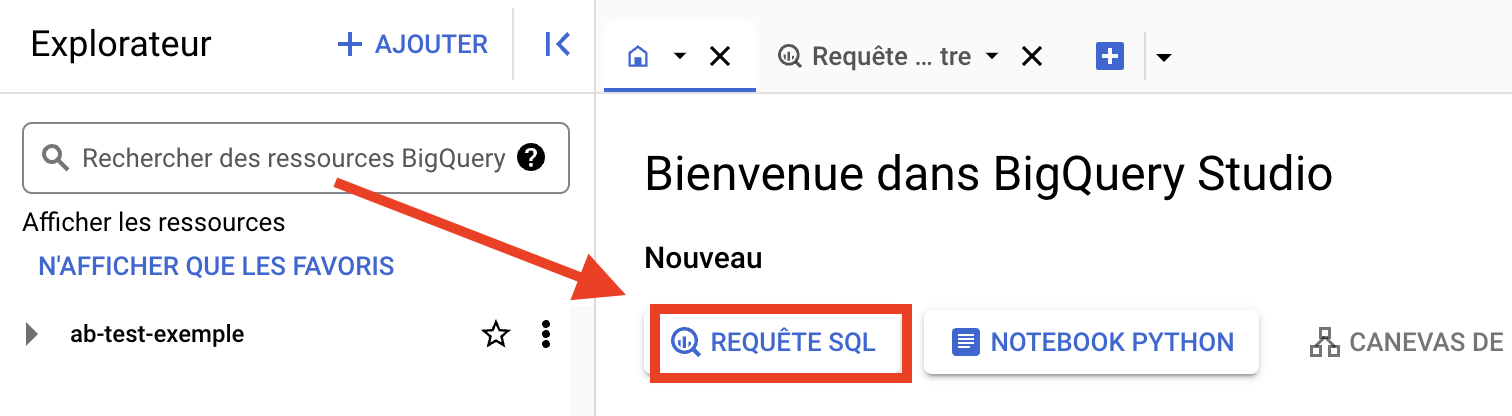
A blank window will appear in which you can write and test your SQL queries.
To analyze precisely what is exploitable in your AB Test events, you can target these events via filters in your queries.
- To target A/B Test events, use the following query:
Pastethe query, replacing your table path with your project_name, analytics_ dataset and event_name: SELECT * FROM `project_name.analytics_XXXXXXXX.events_XXXXXXXX` where event_name in("your_event_name") LIMIT 10
- Click on "Run".
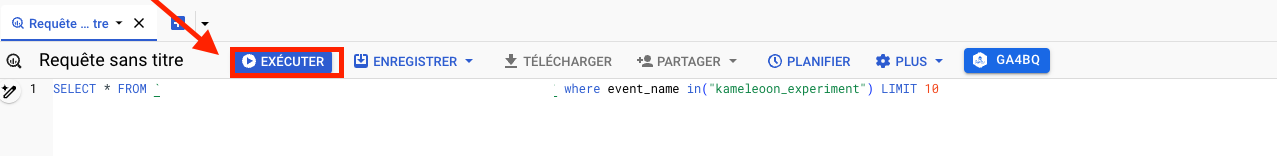
- Once executed, you can analyze your AB Test event.
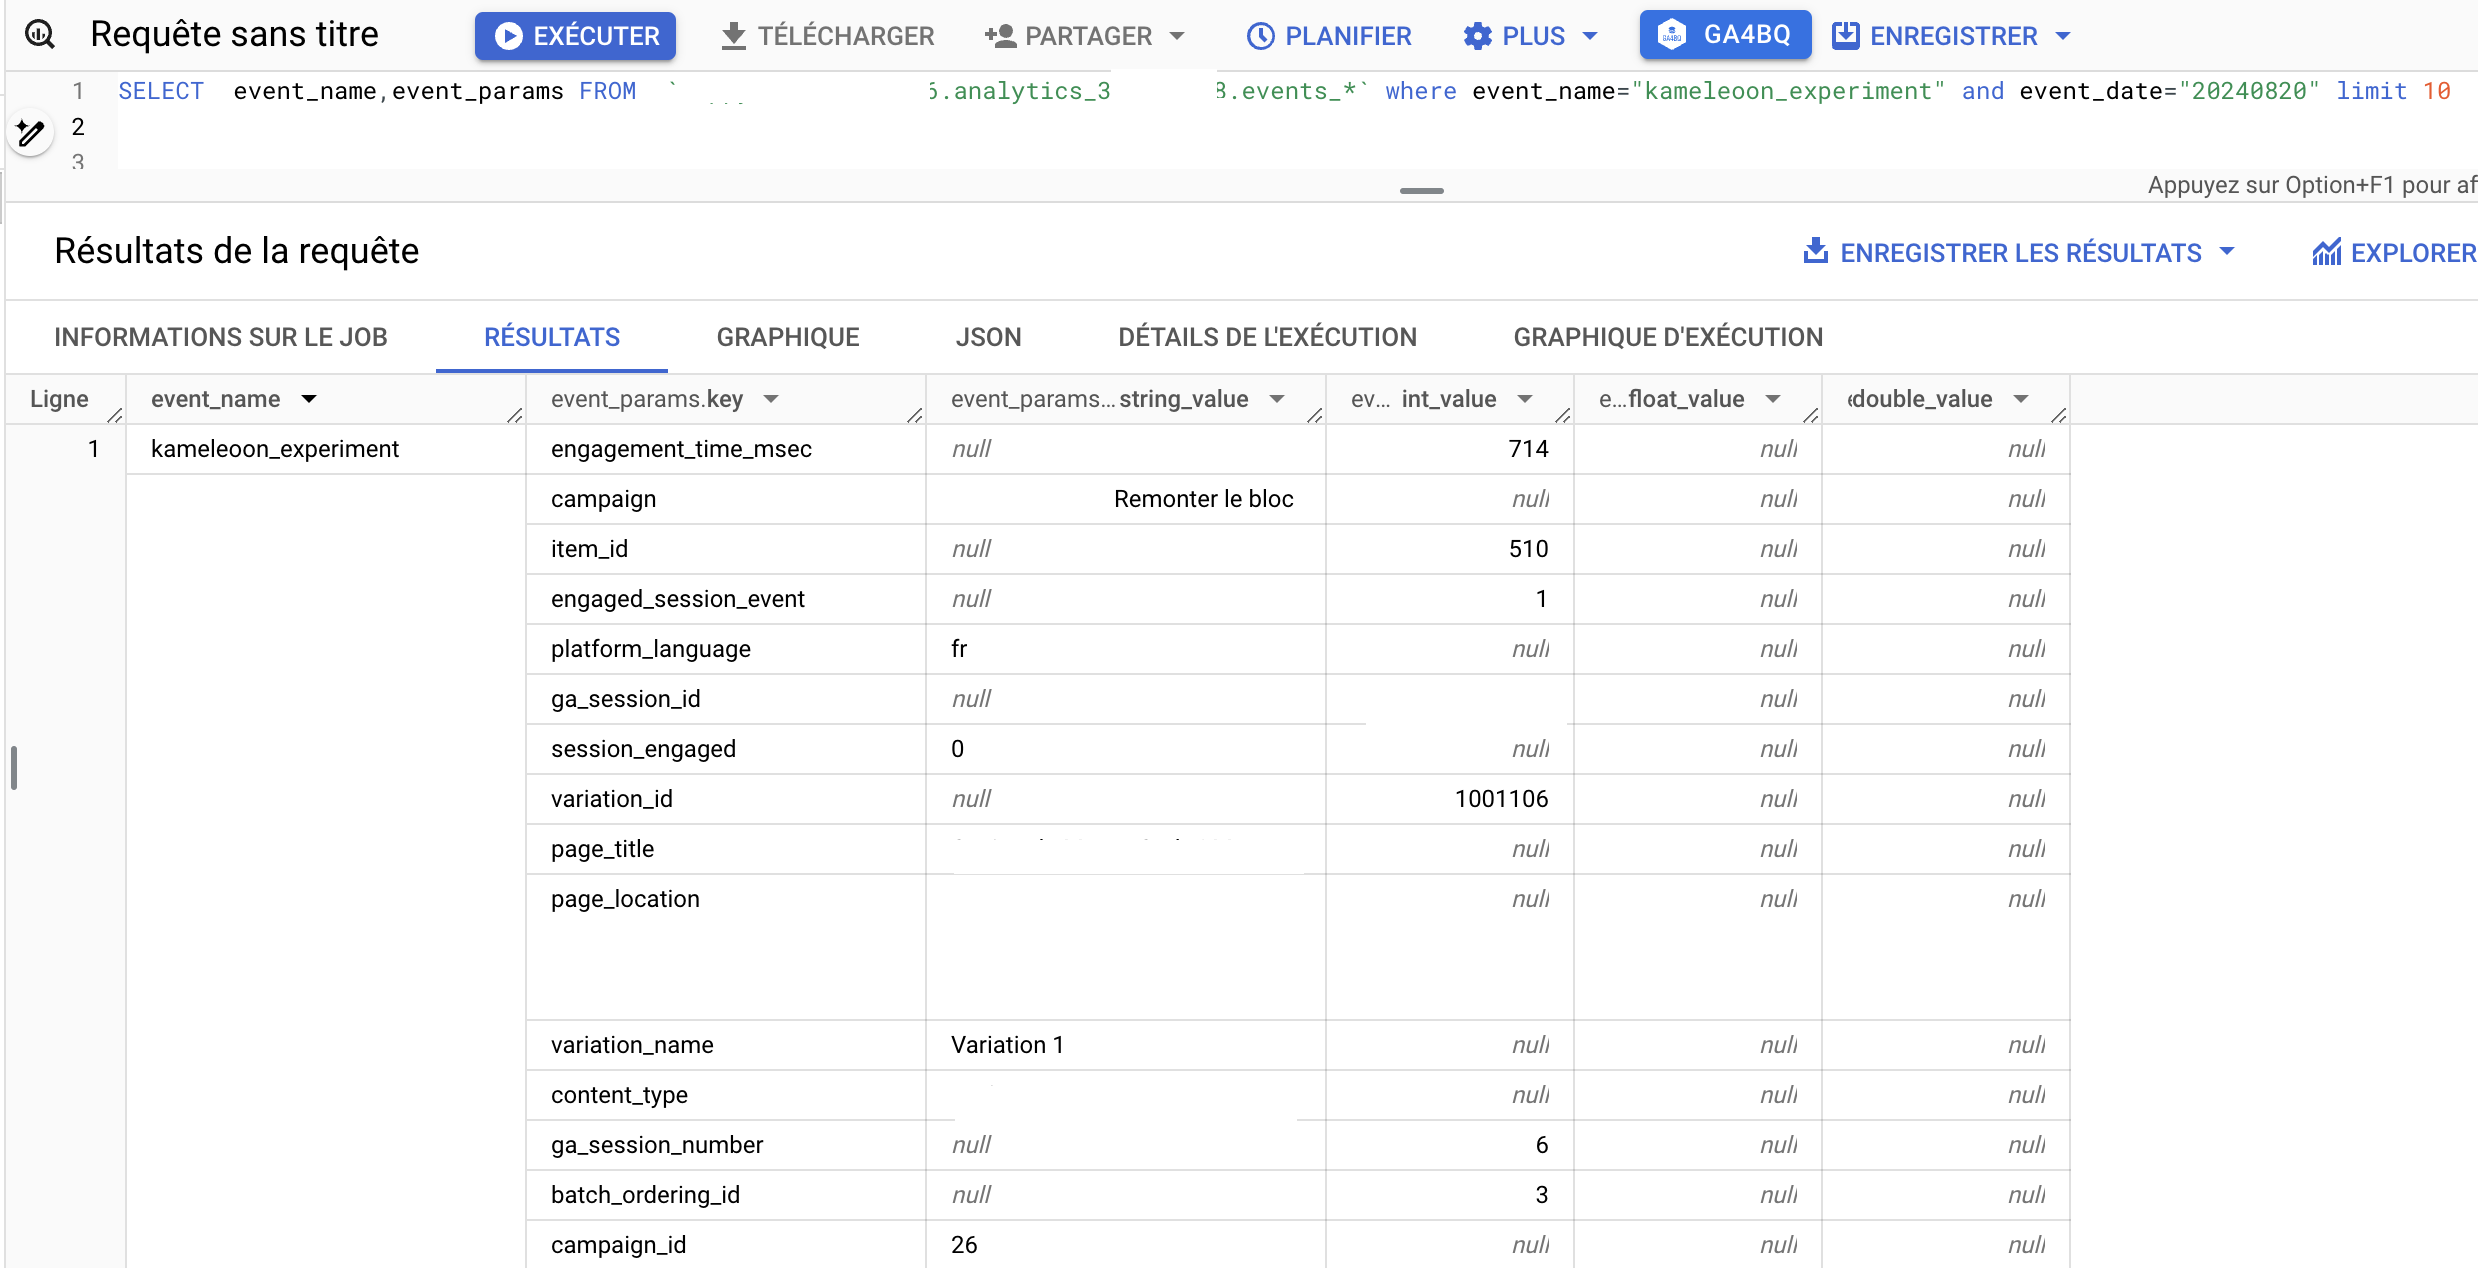
This gives you the power to define all the dimensions and metrics you need for your A/B Test analyses.
Define the dimensions and metrics of your analyses
Start by identifying and classifying the dimensions and metrics that will be needed for your analysis: create (some KPI's are customized) the key dimensions and metrics that reflect the performance of your A/B tests.
Sample classifications:
- G4 native dimensions: experiment_name, variation_name, campaign_id, device_type.
- Native G4 metrics conversion_rate, sessions,page_view, average_session_time.
- Customized metrics in BigQuery uplift, downlift.
Once you've defined your dimensions and metrics, you can set up your SQL query.
Prepare your SQL query to aggregate your data in BigQuery
Once you know what you need for your analyses, you need to create a SQL query tailored to your needs. You can use AI to generate your query.
Here's an example of a query to obtain the dimensions and metrics mentioned above:
WITH experiment_events AS (SELECT user_pseudo_id,event_timestamp,event_name,(SELECT value.string_value FROM UNNEST(event_params) WHERE KEY='campaign') AS campaign,(SELECT value.string_value FROM UNNEST(event_params) WHERE KEY='variation_name') AS variation_name,(SELECT value.int_value FROM UNNEST(event_params) WHERE KEY='campaign_id') AS campaign_id,device.category as device_type FROM `project_name.data_set.events_*` WHERE event_name IN ('kameleoon_experiment','conversion','session_start','page_view')), session_metrics AS (SELECT user_pseudo_id,AVG(event_timestamp) OVER (PARTITION BY user_pseudo_id) - MIN(event_timestamp) OVER (PARTITION BY user_pseudo_id) AS session_duration FROM experiment_events WHERE event_name='session_start') SELECT campaign,variation_name,campaign_id,device_type,SAFE_DIVIDE(COUNTIF(event_name='conversion'),COUNTIF(event_name='session_start')) AS conversion_rate,COUNTIF(event_name='session_start') AS sessions,AVG(session_duration) AS average_session_time,SAFE_DIVIDE(COUNTIF(event_name='conversion'),COUNTIF(event_name='session_start'))-(SELECT SAFE_DIVIDE(COUNTIF(event_name='conversion'),COUNTIF(event_name='session_start')) FROM experiment_events WHERE variation_name='control') AS uplift,(SELECT SAFE_DIVIDE(COUNTIF(event_name='conversion'),COUNTIF(event_name='session_start')) FROM experiment_events WHERE variation_name='control')-SAFE_DIVIDE(COUNTIF(event_name='conversion'),COUNTIF(event_name='session_start')) AS downlift FROM experiment_events JOIN session_metrics USING (user_pseudo_id) GROUP BY campaign,variation_name,campaign_id,device_type ORDER BY conversion_rate DESC limit 10
This is an example query: don't use this query for your analyses, but you can use it as inspiration to create your own.
Then follow the same process you saw earlier for executing queries, run your query in BigQuery Studio and check your results .

Once you've got your query results, you can then create programmed queries that trigger automatically.
Create your programmed queries
Automatic queries are used to create tables, which are then available for Looker Studio to connect to.
When you are in BigQuery Studio and your query results are good, you can take the following steps:
- Click on Schedule.

A window will open on the right, in which you can configure your request.
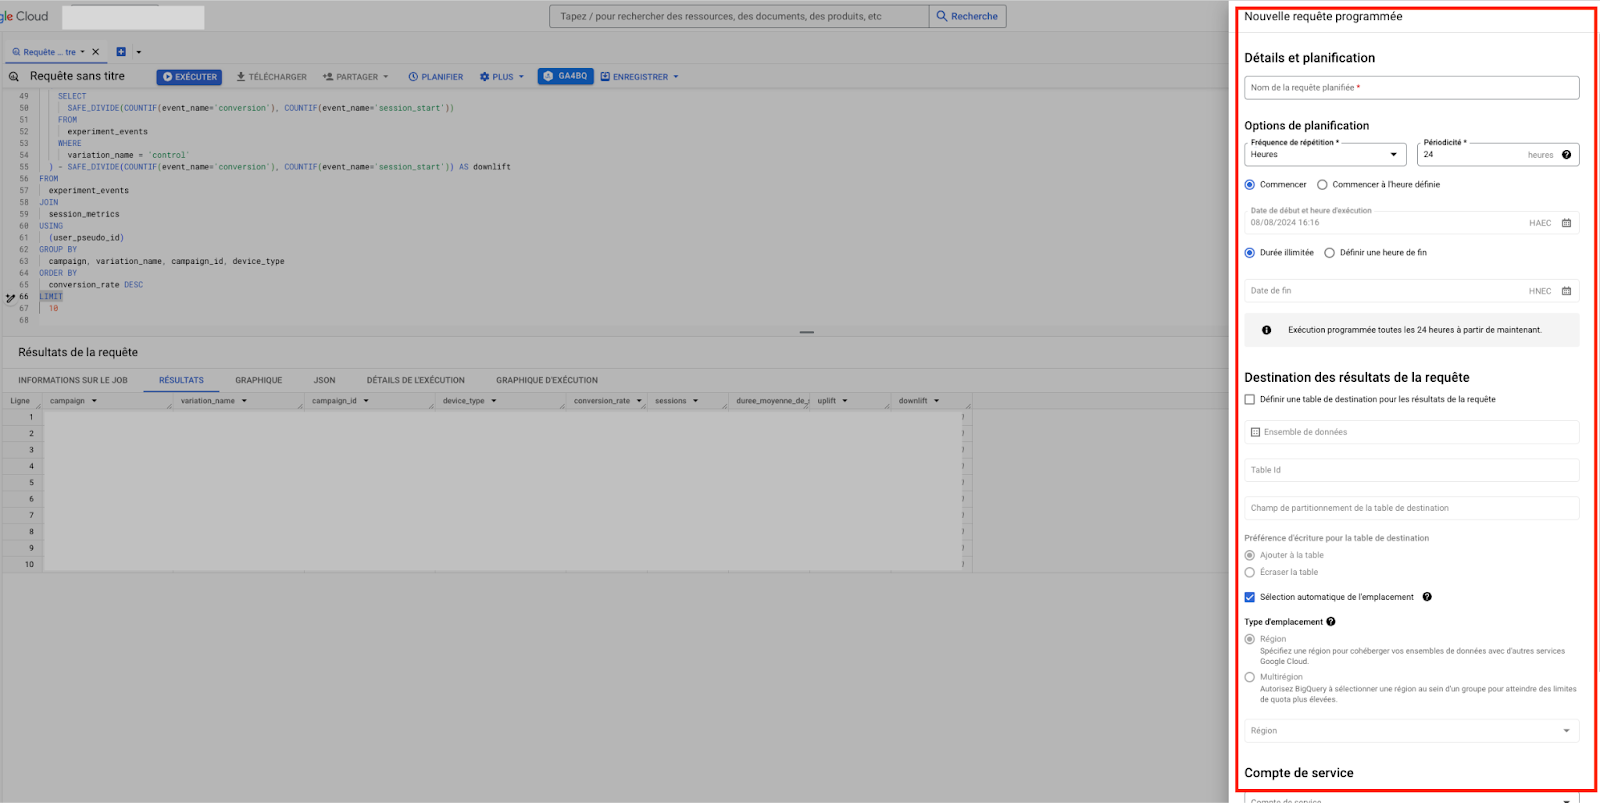
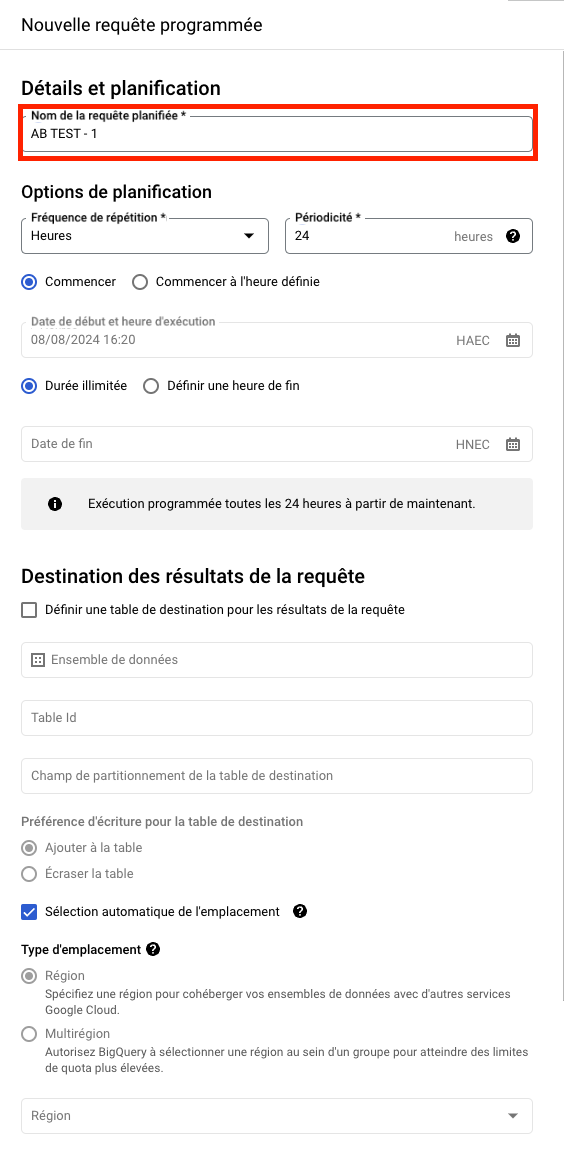
- Configure the programmed request :
- The name of the request: you can name it "ab test" with the name of your project or the name of the site, or the type of test.
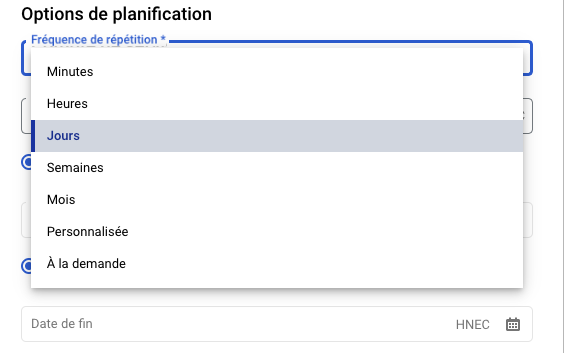
- Repetition frequency : you can choose the frequency most suited to your needs. We choose a frequency by Days to have a weekly vision and to adapt to the daily export of GA4.
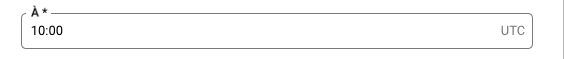
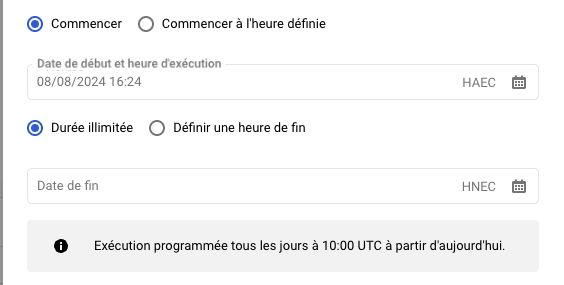
- Repetition frequency time: the time is in UTC, so we choose a time that is later than the reception of GA4 data, to prevent the query from being triggered before the data has been received.
- Start and end times : if we don't touch anything, the request will be triggered for the first time the next time it's run according to our schedule, and will continue to run at the same frequency indefinitely.
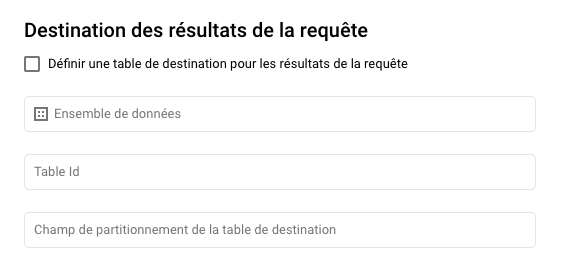
- Define the query destination.
You can :
- Create a dedicated dataset
- Choose an existing dataset (e.g. your analytics_XXXXX dataset created by the GA4 connection)
Let's see how to proceed for both possibilities.
- Create a dedicated dataset: in the condition where you want to create a dedicated dataset , click on "CREATE A DATA SET".

- A window will open where you can name your dataset , for example: A/B Test, then select the region (you need to select the same region as the analytics dataset, otherwise you won't be able to program the query in this dataset), then click on "CREATE DATASET".

- Once your dataset has been created or not, select the dataset, and name your destination table (often, for simplicity's sake, we use the same name for the scheduled query as for the table name).

- Writing preference:
- Add to table: add rows after the table, then adapt the SQL query accordingly to avoid duplication.
- Overwrite table: replaces the table with new query results every time it's run, avoiding duplicates and requiring no modification of your query.

- You can automatically select the region by checking the "Automatic location selection" box.
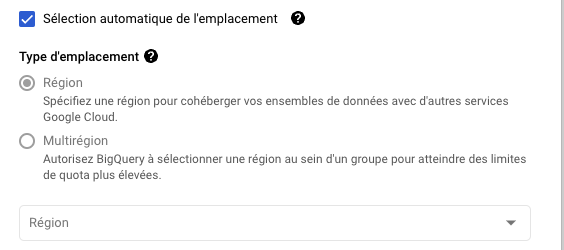
If you want to select it manually: it must match that of your analytics dataset.
- Save the programmed query, then you can check the programming of the query by going to the menu on the left, go to "Programmed queries.
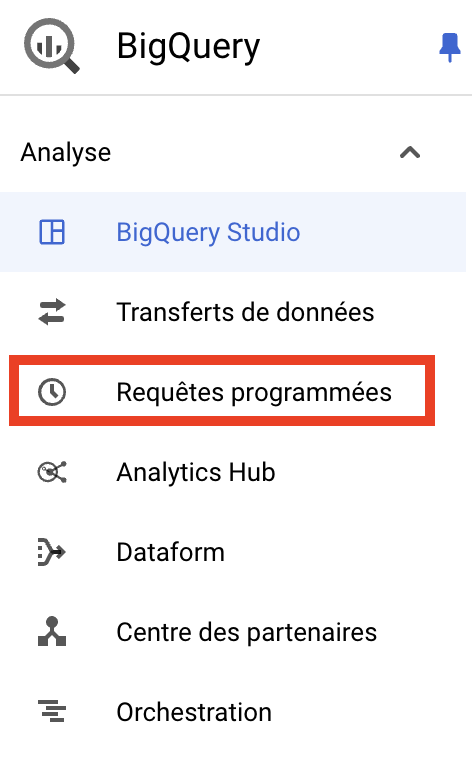
This is the Programmed Queries interface:
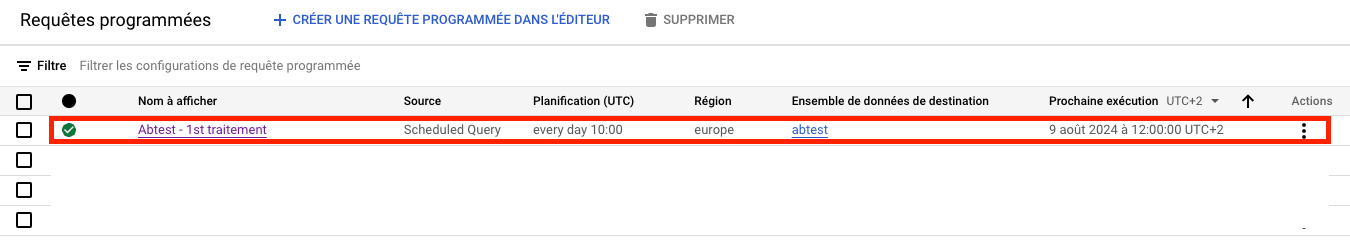
You will find the following information :
- Query name
- Source: will always be Scheduled Query
- Planning: Corresponds to your planning settings, i.e. frequency and schedule.
- Region: in which region you have set up your programmed query
- Destination dataset: This is the destination where the results of your query will be stored.
- The next run
- Actions: You can delete or deactivate (it will be inactive)
If you want to test your query to make sure there are no programming issues, you can run it manually.
To do this, click on your request to go to the details of your scheduled request, then click on Schedule filling.

Click Back, and you'll see that the request is being processed with this symbol.

If there are no execution problems, you'll see the validation symbol.

If it doesn't, you'll see an error symbol. If this happens, go to the details of your request to find out more about the error and how to resolve it. There may be many reasons for this. Here's some documentation if you're having trouble: Query execution problems.
Once you've programmed your request, you're all set to make the connection with looker studio.
Create an A/B test monitoring dashboard in Looker Studio
How do I connect Looker Studio to BigQuery?
Looker Studio has native BigQuery connectors that enable it to use data directly from your BigQuery tables.
- Go to Looker Studio.
- If you don't have one, create an account.
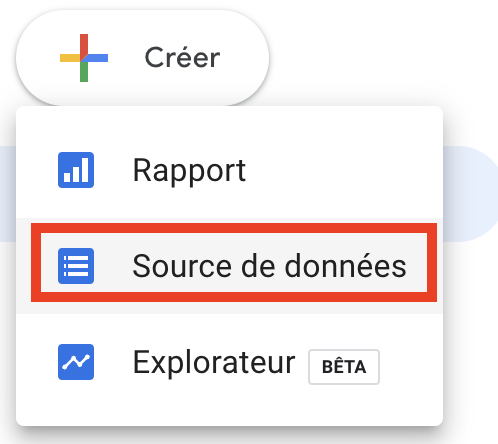
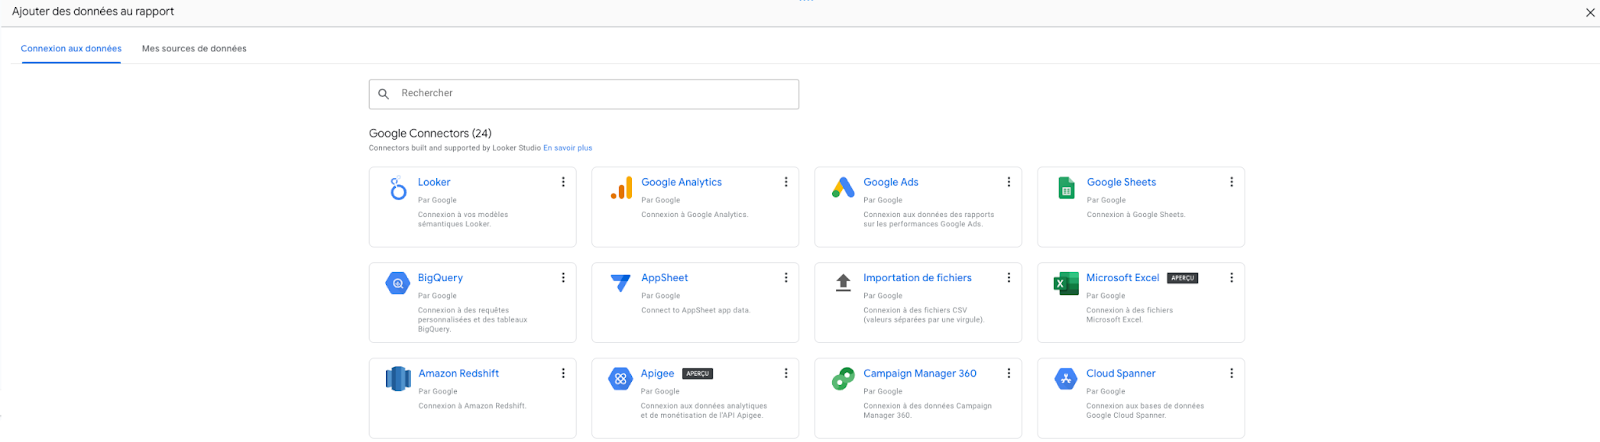
- We're now going to define our BigQuery tables as data sources. Then click on create, then on data source.
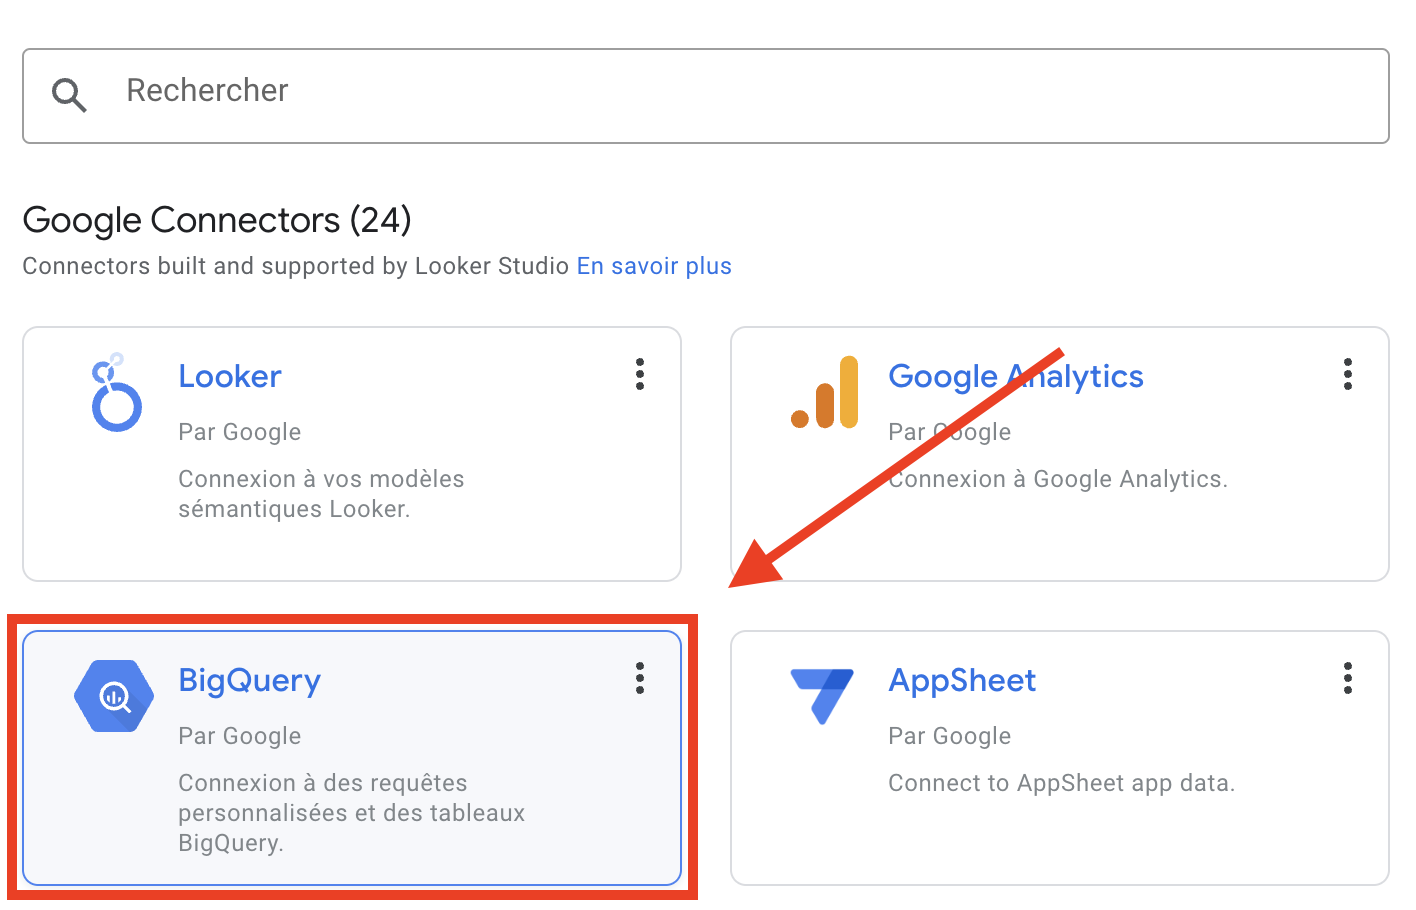
- Choose the BigQuery connector.
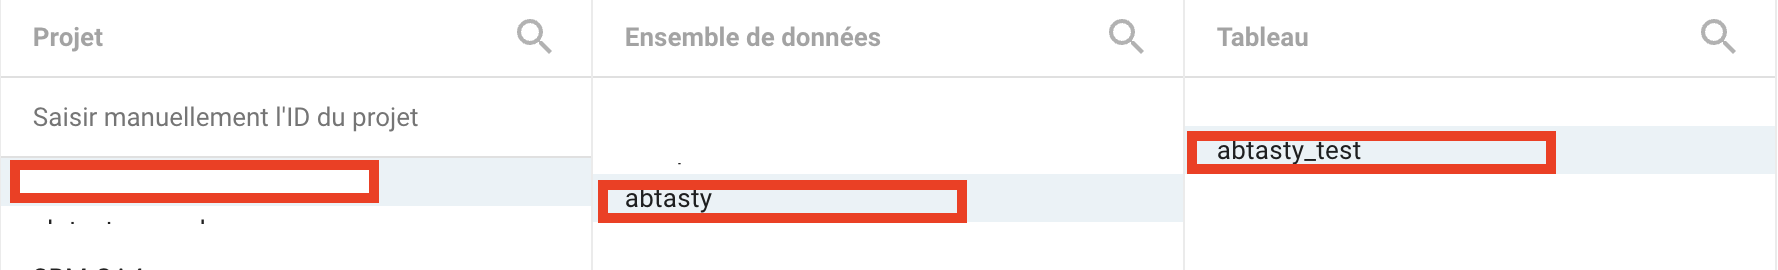
- Select the corresponding table: You must select the project, then the dataset, then the table that corresponds to your programmed query destination table, then click on associate.
- Name your data source, e.g. "A/B Test - BigQuery".
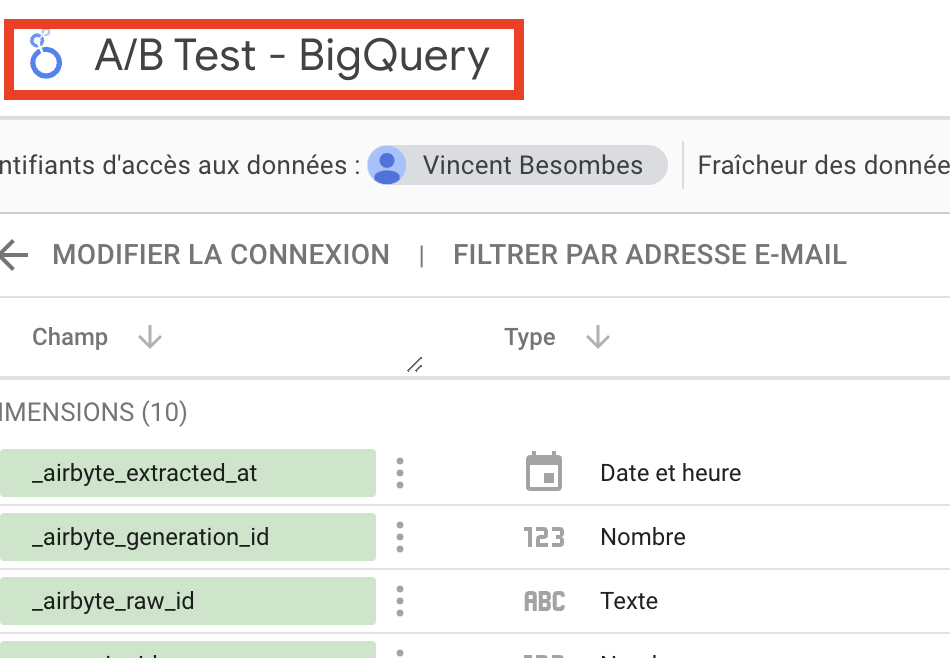
With your data source integrated into Looker Studio, you can now start creating your dashboard.
Create your Dashboard
Once connected to your tables in Looker Studio, create your dashboard using the available dimensions and metrics, to easily visualize and analyze the performance of your A/B tests.
- Create a report in Looker Studio, which will be your dashboard.
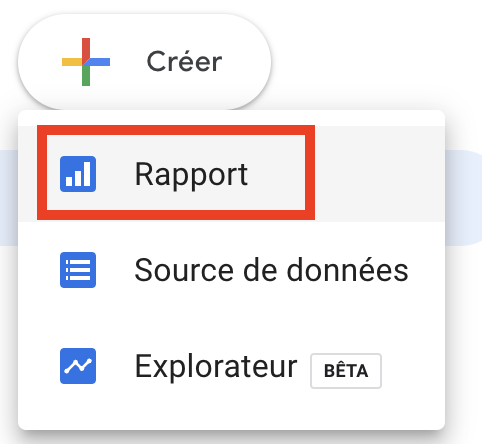
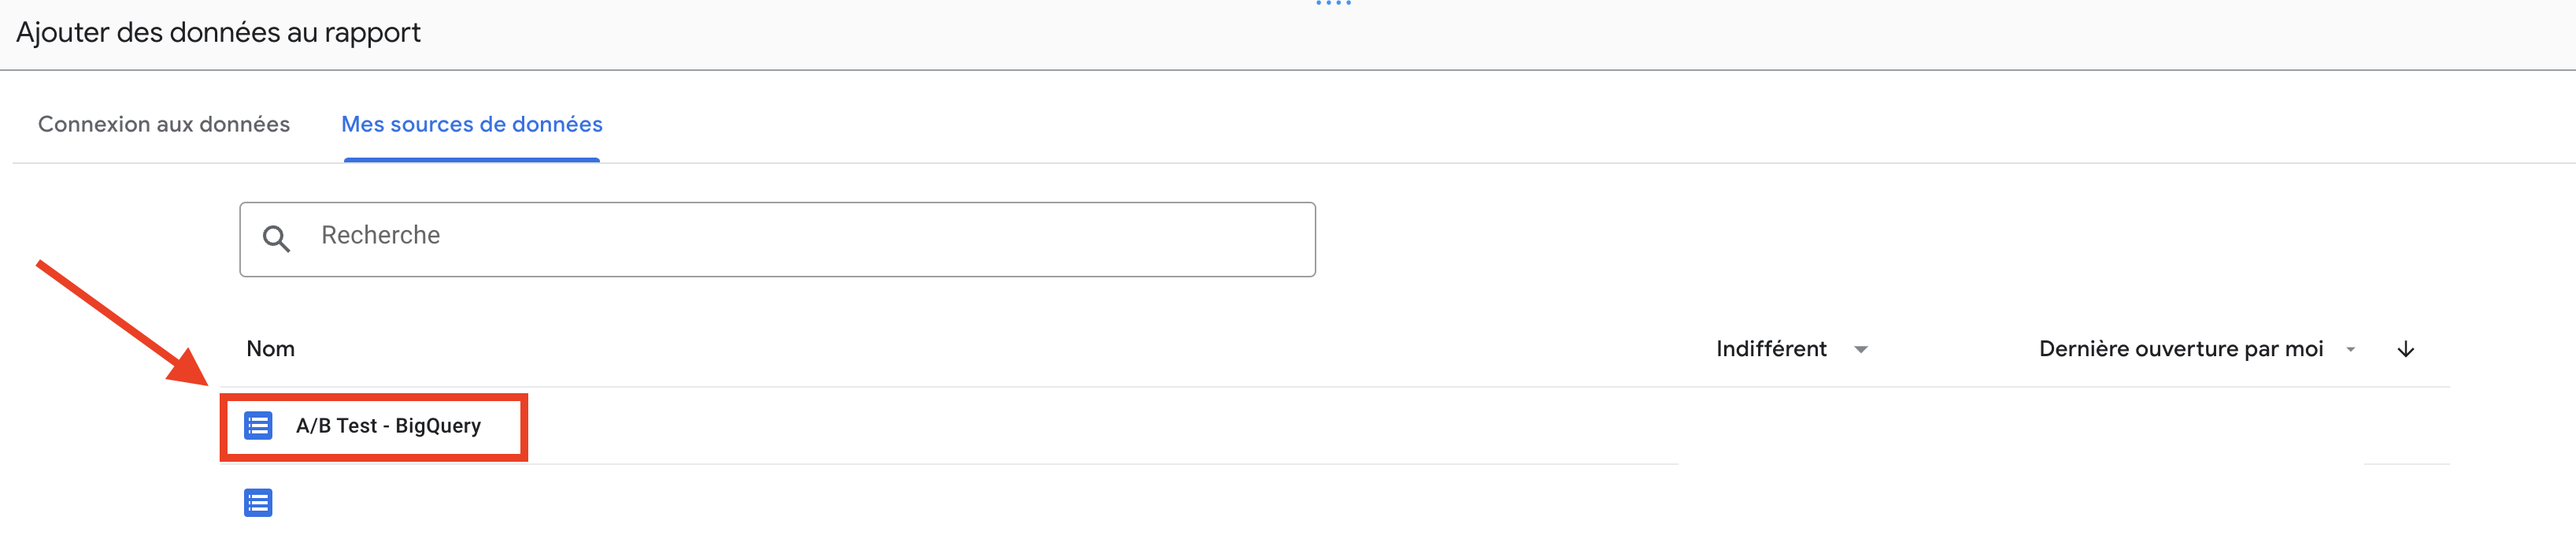
When creating a report, Looker Studio automatically prompts you to add a data source.
- Go to "My data sources".
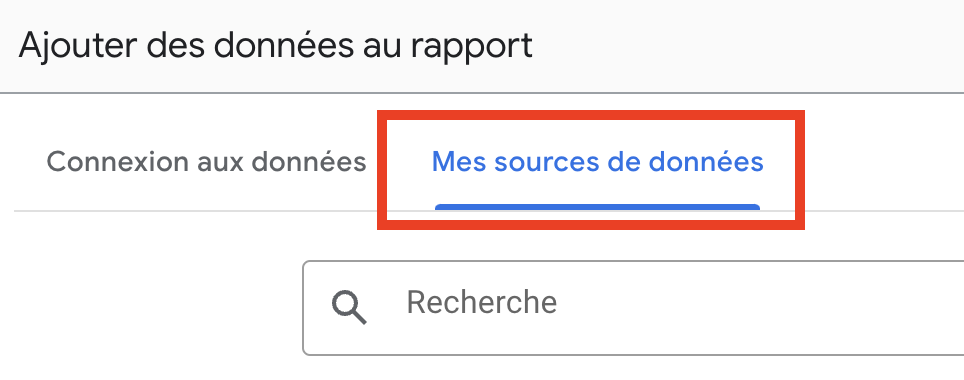
- Add your BigQuery data source.
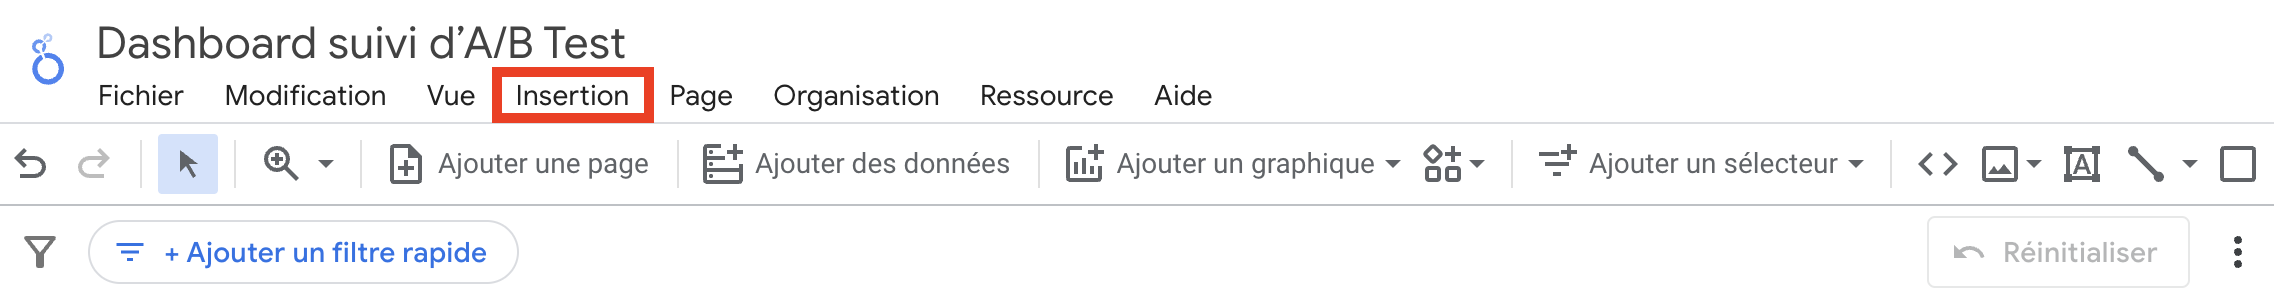
- In the top left-hand corner of your report, name it "Dashboard followed by A/B Test".

- Insert the appropriate visualizations to create your Dashboard.
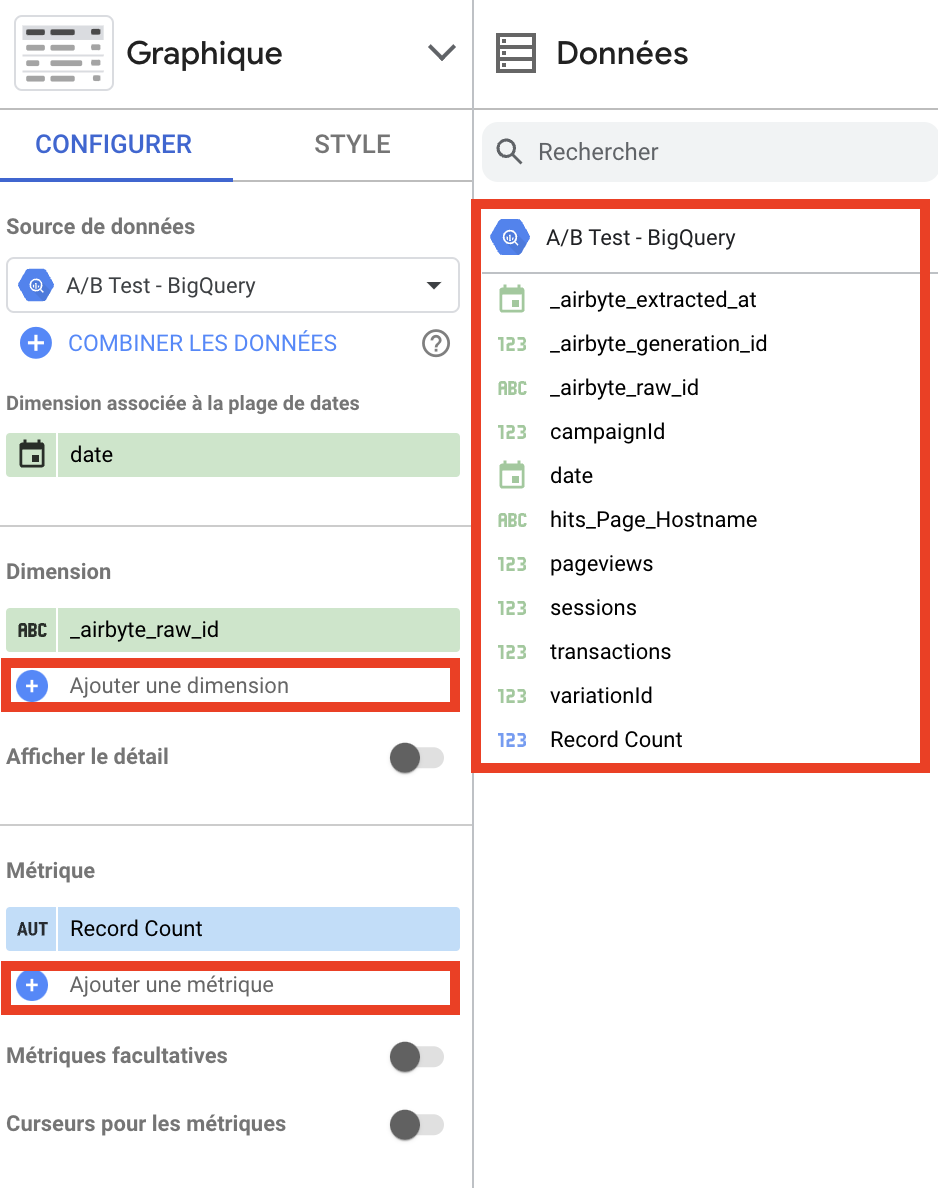
- Add your dimensions and metrics.
When you click on your visualization in the banner on the right, you'll see .
Inside it, on the right in "data" below your source, you'll find a list of dimensions and metrics.
You can drag and drop them, or click on "Add dimension/metric" to add them to your visualization.
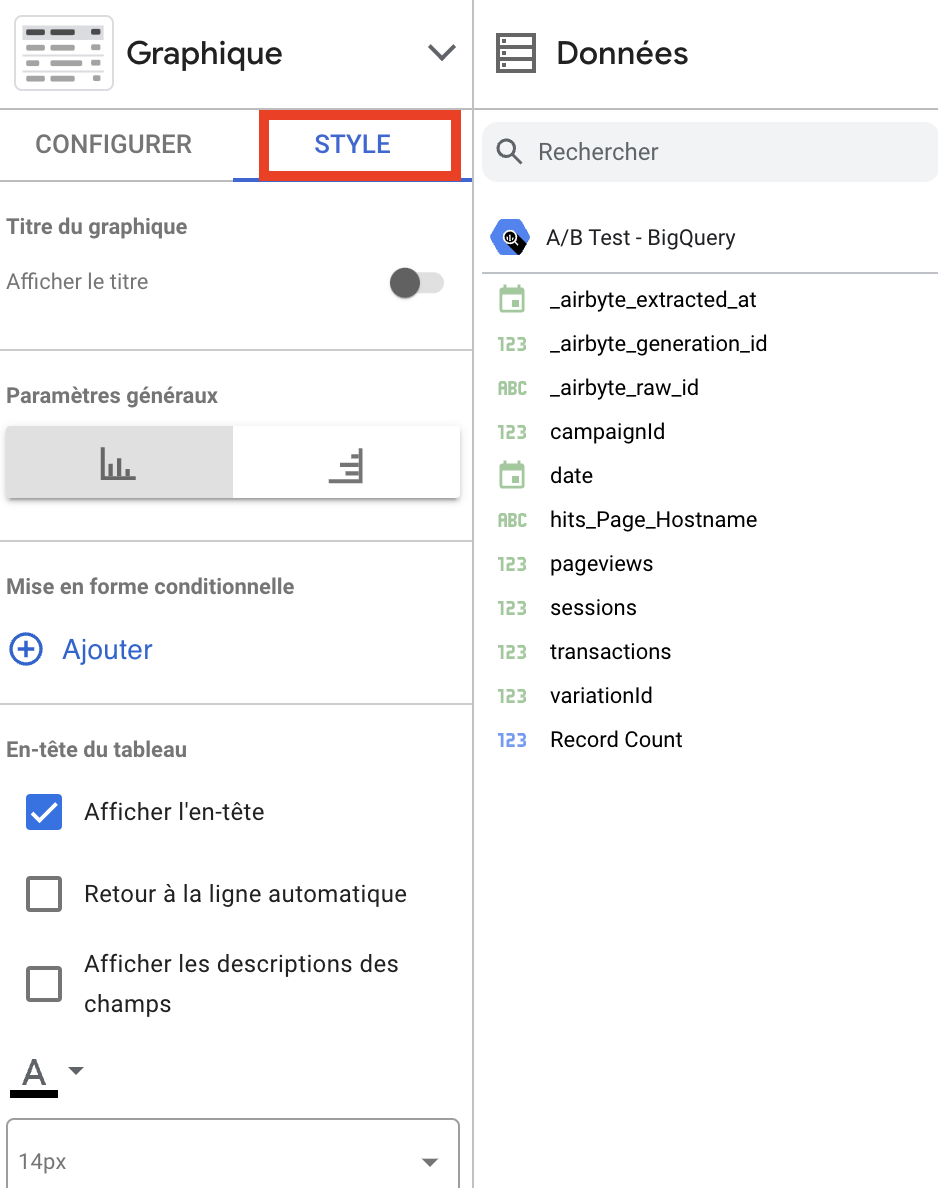
- To style your visualizations, click on your visualization, then click on the "Style" button to display the parameters for customizing the style of your dataviz.
You now have the tools you need to create your own Looker Studio dashboard for tracking your A/B test data, using BigQuery for decisive insights via advanced dataviz.
Want to find out more? Discover our offershere

.png)
.png)


.png)

.png)

